


Natural Gas Statistics: Natural gas is a fossil fuel composed primarily of methane (CH4), along with smaller amounts of other hydrocarbons such as ethane, propane, and butane.
It is a versatile and abundant energy source that is used for various purposes, including heating, electricity generation, industrial processes, and transportation.

Editor’s Choice
- The Global Natural Gas Generator Market size is expected to be worth around USD 26 Billion by 2033, from USD 8.8 Billion in 2023, growing at a CAGR of 11.4% during the forecast period from 2024 to 2033.
- EIA forecast that natural gas production will average around 103 Bcf/d in the second half of 2023 and 2024, staying quite close to record levels for much of the remainder of the forecast period.
- As of 2021, the world’s proven natural gas reserves were estimated at approximately 196.7 trillion cubic meters.
- In 2020, the world produced around 4,116 billion cubic meters (bcm) of natural gas.
- The United States was the largest natural gas producer in the world in 2020, with a production of 948 bcm.
- The United States was the largest natural gas consumer globally in 2020, with a consumption of 846 bcm.
- In 2020, Russia was the largest exporter of natural gas, exporting approximately 200 bcm.
- In 2020, Japan was the largest natural gas importer, importing around 103 bcm.
- The average global natural gas price in 2020 was $2.45 per million British thermal units (MMBtu).
- Natural gas accounted for about 23.7% of global electricity generation in 2020.
- Natural gas emits around 50-60% less carbon dioxide (CO2) compared to coal when used for electricity generation.
(Source: International Energy Agency – IEA, US Energy Information Administration, International Gas Union)
Natural Gas Key Statistics 2023
- The average monthly spot natural gas price at the U.S. benchmark Henry Hub fell 34%, or $1.12/MMBtu, from January to June 2023, reaching an average of $2.18/MMBtu in June.
- Prices averaged below $2.50/MMBtu from February to June, the lowest average monthly Henry Hub price since June 2020.
- Natural gas prices for the first half of 2023 are down 62%, or $3.96/MMBtu, compared to the first half of 2022 (when adjusted for inflation).
- Warmer-than-average temperatures in the Lower 48 states resulted in fewer population-weighted heating degree days (HDDs) in January and February 2023 compared to the five-year average.
- Lower HDDs led to lower natural gas consumption for space heating and lower storage inventory withdrawals.
- Overall U.S. natural gas consumption averaged 103.0 Bcf/d between January and March 2023, a decrease of 1.9 Bcf/d compared to the same period in 2022.
- Dry natural gas production in the first six months of 2023 increased by an estimated 6.2 Bcf/d compared to the previous year
- Storage inventories in the Lower 48 states at the end of the withdrawal season (October 31–March 31) were 19% (294 Bcf) above the five-year average.
- Storage inventories have remained well above the five-year average during the summer injection season (April 1–October 31), due to mild temperatures and high levels of dry natural gas production.
(Source: EIA’s Weekly Natural Gas Storage Report).

Natural Gas Statistics – Gas Reserves
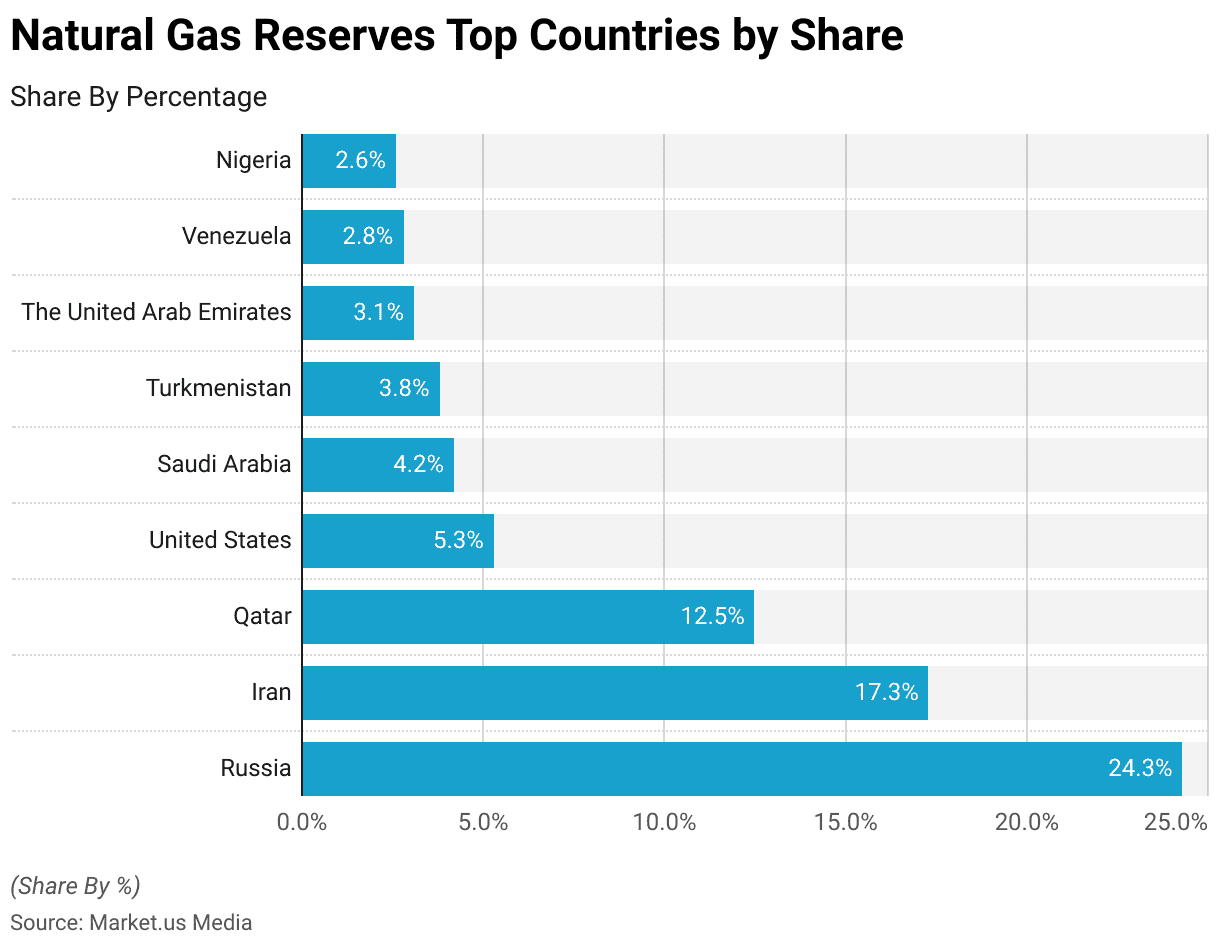
- As of 2021, the world’s total proven natural gas reserves were estimated to be approximately 196.7 trillion cubic meters (Tcm).
- Russia: Russia has the largest proven natural gas reserves in the world, estimated at around 38.3 Tcm.
- Iran: Iran holds the second-largest natural gas reserves globally, with approximately 32.6 Tcm.
- Qatar: Qatar ranks third in terms of natural gas reserves, with around 24.7 Tcm.
- United States: The United States holds significant natural gas reserves, estimated at approximately 12.9 Tcm.
- Saudi Arabia: Saudi Arabia has substantial natural gas reserves, estimated at around 10.6 Tcm.
- As of 2022, global natural gas reserves amounted to approximately 202 trillion cubic meters.
- Conventional natural gas reserves accounted for the majority, representing 94% of the total volume.
- Within the unconventional reserves, shale gas accounted for 86% of the total unconventional volume.
(Source: BP Statistical Review of World Energy 2021, Statista)

Natural Gas Statistics – Gas Production
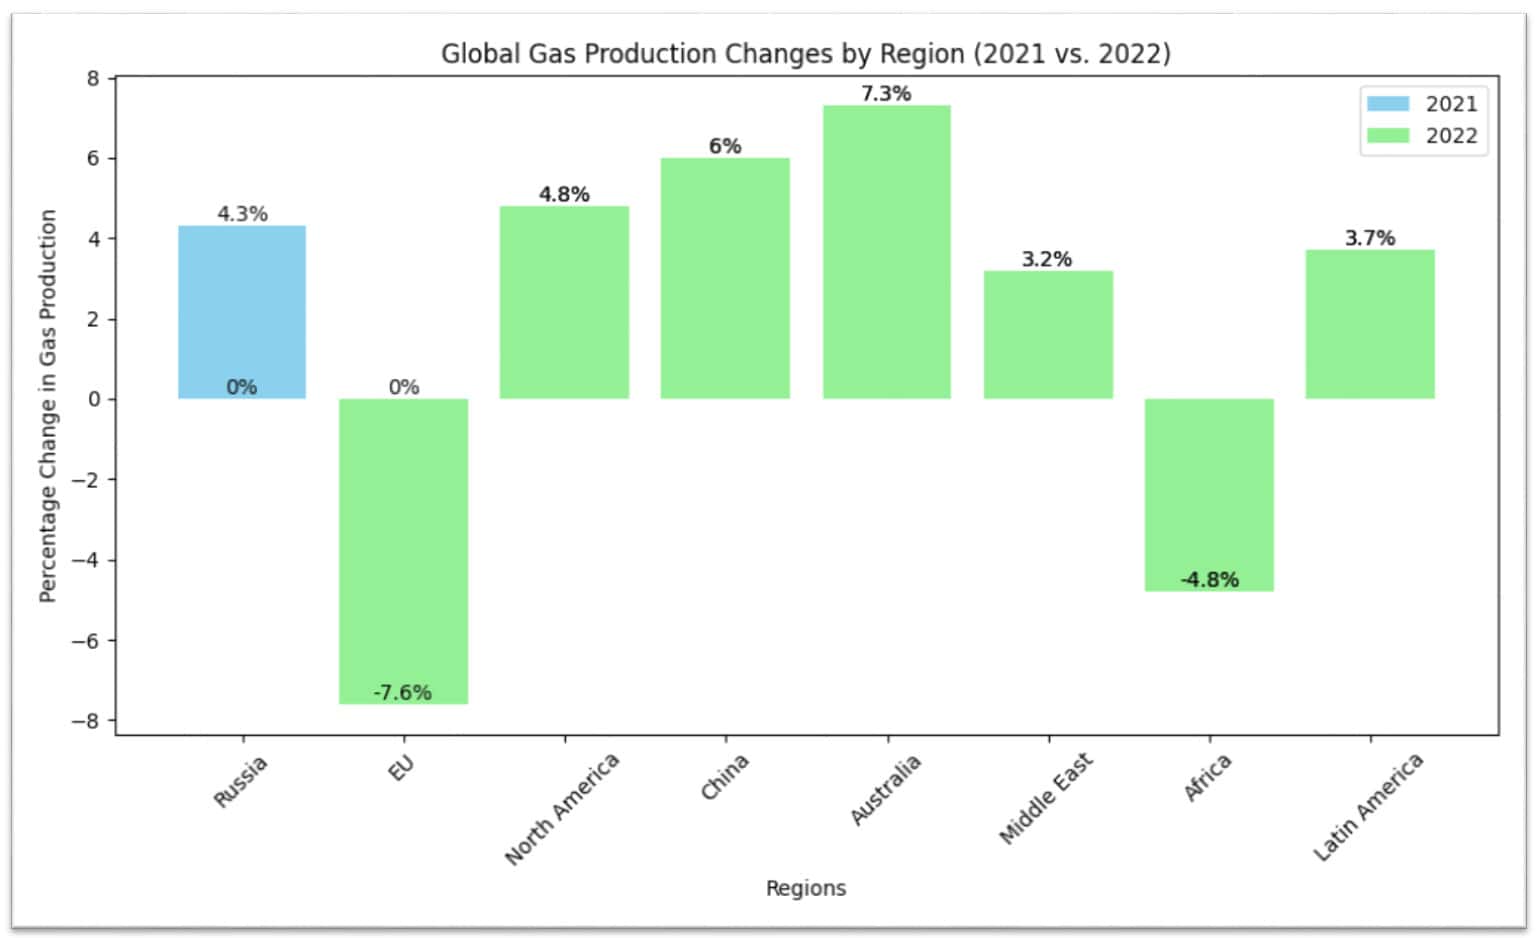
- Global gas production increased by 4.3% in 2021 but remained stable in 2022 due to lower gas demand.
- Russia experienced a significant decline in gas production, with a decrease of 12% in 2022, primarily driven by lower exports to Europe.
- However, the decline in Russia’s production was offset by higher gas output in other regions, including North America, the Middle East, China, and Australia.
- North America witnessed growth in gas production by 4.8% in 2022, with the United States contributing to a 4.3% increase and Canada’s to a 7.3% increase.
- China experienced a 6% increase in gas production, while Australia saw a notable rise of 7.3%.
- Gas production in the Middle East also showed positive growth, with a 3.2% increase.
- In Latin America, gas production grew by 3.7%, primarily driven by the development of the Vaca Muerta field in Argentina and growth in Mexico.
- However, Brazil experienced a nearly 7% drop in gas production due to a significant decline in gas consumption.
- In Europe, the Netherlands observed a continuous decrease in gas production with a decline of 15% in 2022, contributing to a 7.6% drop in EU gas production.
- On the other hand, Norway and the United Kingdom offset part of the decline in the EU with higher gas output.
- Gas production in Africa also declined by 4.8%, with lower output in Algeria, Egypt, and Nigeria.
(Source: Enerdata)
Global Natural Gas Consumption Statistics
- Global natural gas consumption in 2023 is projected to rise by around 1% year on year, with growth being driven by the US, China, and some emerging markets in Asia-Pacific.
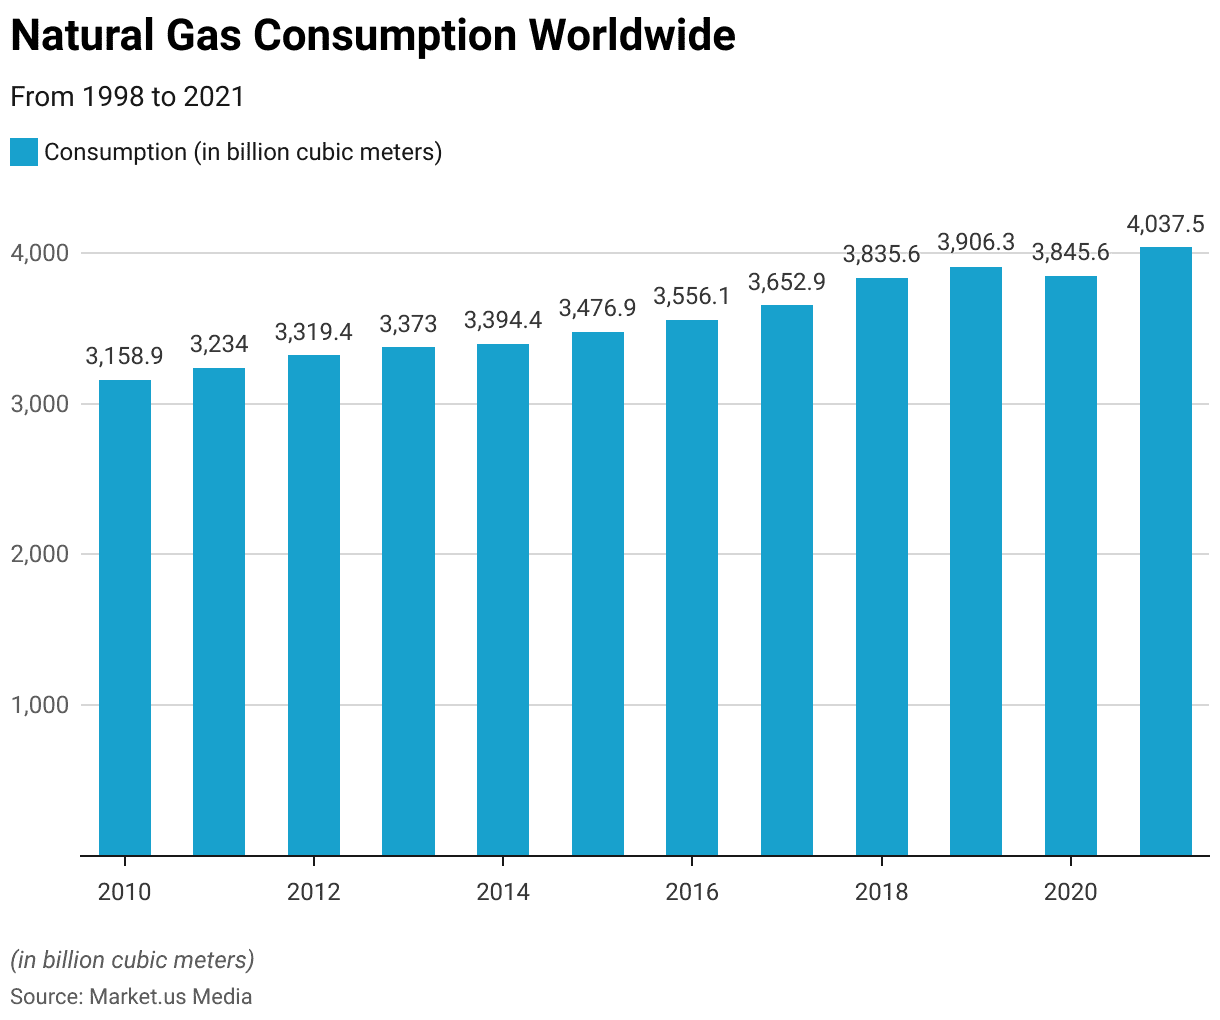
- In 2022, the world consumed approximately 4,072 billion cubic meters (bcm) of natural gas.
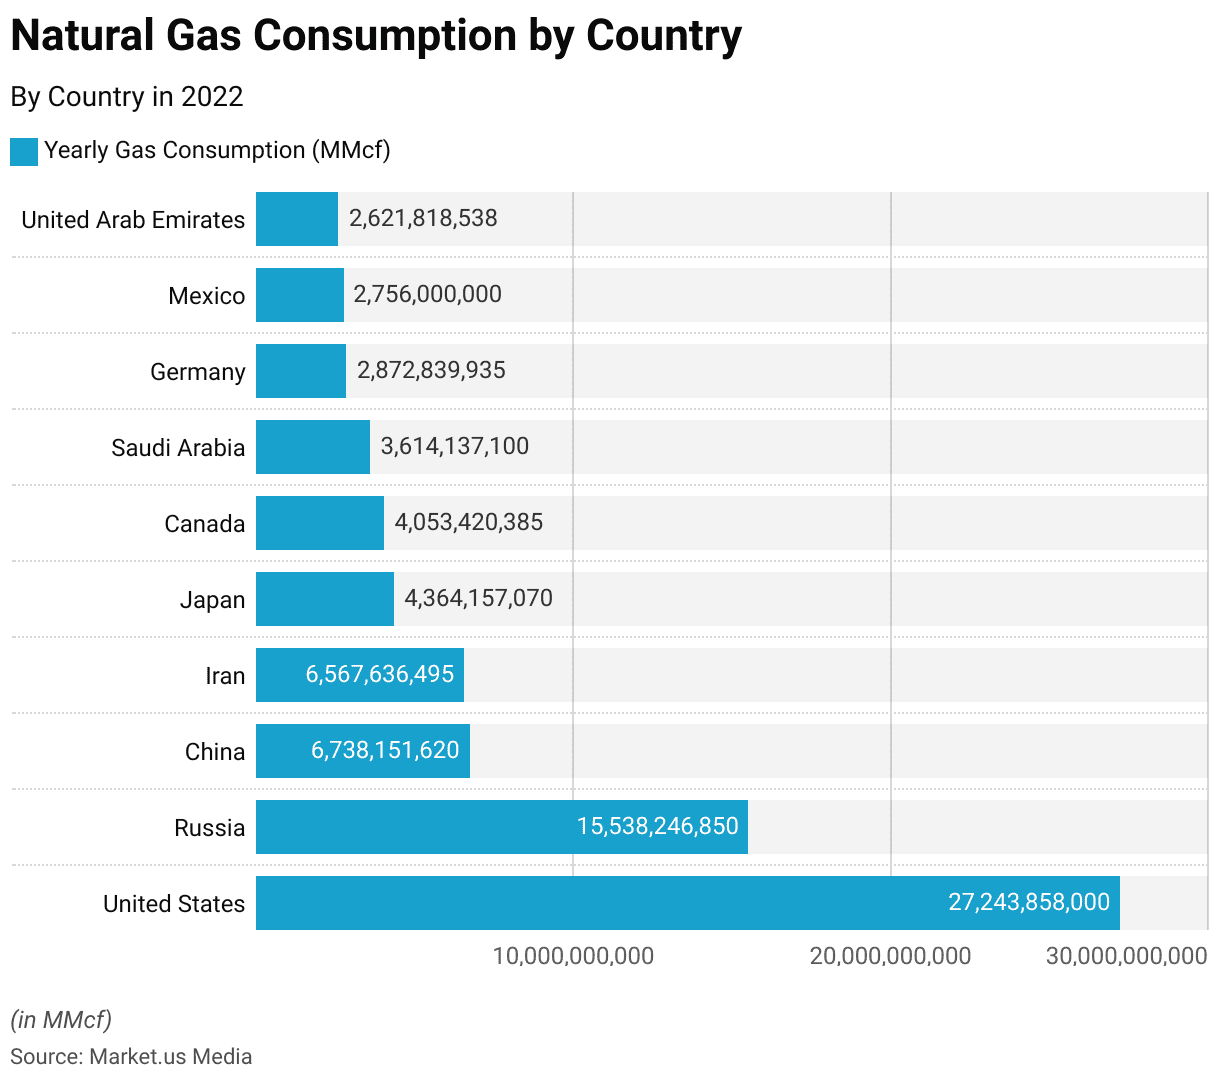
- The United States was the largest natural gas consumer in the world in 2020, with a consumption of approximately 846 bcm (IEA).
- China ranked second in terms of natural gas consumption, with a consumption of around 329 bcm in 2020 (IEA).
- Russia was among the top natural gas consumers, with a consumption of about 200 bcm in 2020.
- The European Union (EU) as a whole consumed approximately 512 bcm of natural gas in 2020.
(Source: S&P Global, International Energy Agency – IEA)

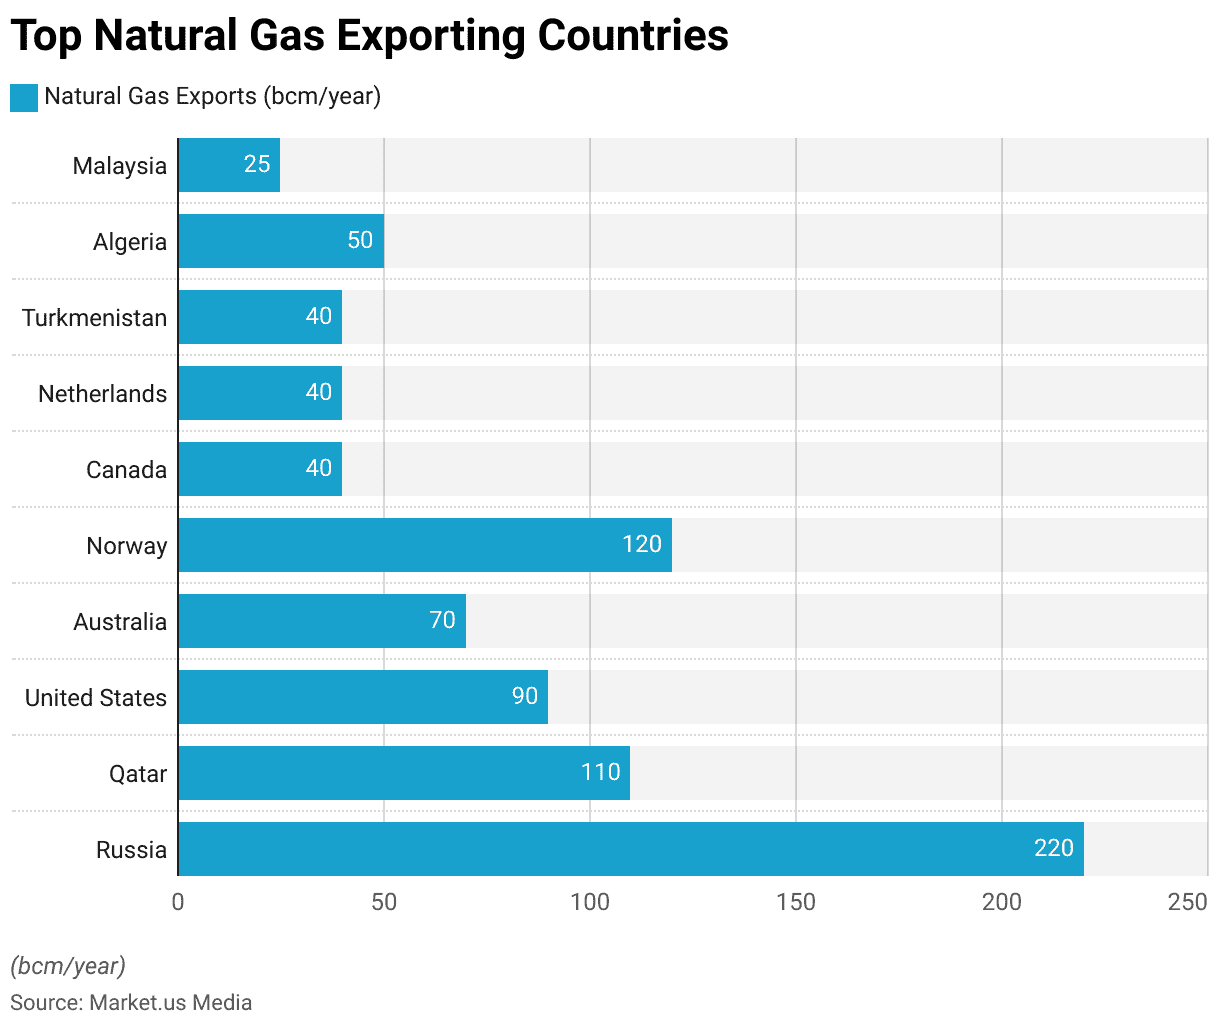
Top Natural Gas Exporting Countries
Russia
- Natural Gas Exports: Approximately 220 billion cubic meters (bcm) per year.
- Major Export Markets: Europe, particularly Germany, Turkey, Italy, and the United Kingdom.
Qatar
- Natural Gas Exports: Approximately 110 bcm per year.
- Major Export Markets: Asia, particularly Japan, South Korea, China, and India.
United States
- Natural Gas Exports: Approximately 90 bcm per year.
- Major Export Markets: Mexico, Canada, Japan, South Korea, and several European countries.
Australia
- Natural Gas Exports: Approximately 70 bcm per year.
- Major Export Markets: Japan, China, South Korea, and various Southeast Asian countries.
Norway
- Natural Gas Exports: Approximately 120 bcm per year.
- Major Export Markets: Europe, particularly the United Kingdom, Germany, France, and Belgium.
Canada
- Natural Gas Exports: Approximately 40 bcm per year.
- Major Export Markets: The United States, particularly for pipeline exports.
Netherlands
- Natural Gas Exports: Approximately 40 bcm per year.
- Major Export Markets: European countries, particularly Germany, Belgium, and France.
Turkmenistan
- Natural Gas Exports: Approximately 40 bcm per year.
- Major Export Markets: China, Iran, and Russia.
Algeria
- Natural Gas Exports: Approximately 50 bcm per year.
- Major Export Markets: Europe, particularly Italy, Spain, and France.
Malaysia
- Natural Gas Exports: Approximately 25 bcm per year.
- Major Export Markets: Japan, South Korea, and various Southeast Asian countries.

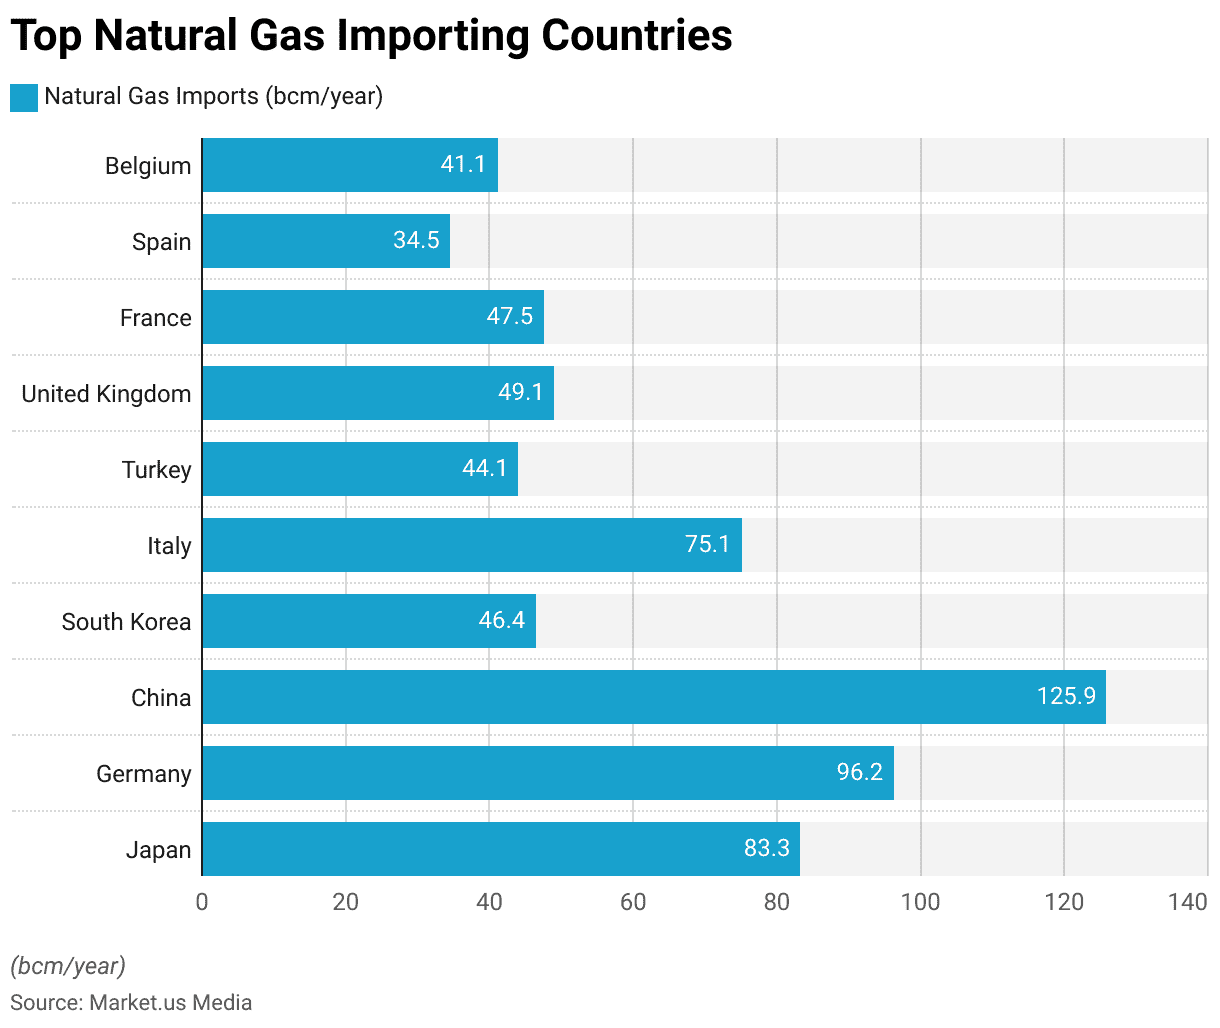
Natural Gas Statistics – Top Importing Countries
Japan
- Natural gas imports: Approximately 83.3 billion cubic meters (bcm) per year.
- Main suppliers: Australia, Qatar, Russia, Malaysia, and the United States.
Germany
- Natural gas imports: Approximately 96.2 bcm per year.
- Main suppliers: Russia, Norway, the Netherlands, Denmark, and the United Kingdom.
China
- Natural gas imports: Approximately 125.9 bcm per year.
- Main suppliers: Australia, Qatar, Russia, Turkmenistan, and Malaysia.
South Korea
- Natural gas imports: Approximately 46.4 bcm per year.
- Main suppliers: Qatar, Australia, the United States, Russia, and Malaysia.
Italy
- Natural gas imports: Approximately 75.1 bcm per year.
- Main suppliers: Russia, Algeria, Norway, the Netherlands, and Libya.
Turkey
- Natural gas imports: Approximately 44.1 bcm per year.
- Main suppliers: Russia, Iran, Azerbaijan, Algeria, and Nigeria.
United Kingdom
- Natural gas imports: Approximately 49.1 bcm per year.
- Main suppliers: Norway, the Netherlands, Belgium, Qatar, and Russia.
France
- Natural gas imports: Approximately 47.5 bcm per year.
- Main suppliers: Norway, Russia, the Netherlands, Qatar, and Algeria.
Spain
- Natural gas imports: Approximately 34.5 bcm per year.
- Main suppliers: Algeria, Nigeria, Qatar, Peru, and Trinidad and Tobago.
Belgium
- Natural gas imports: Approximately 41.1 bcm per year.
- Main suppliers: The Netherlands, Norway, the United Kingdom, France, and Germany.

Natural Gas Statistics – Gas Price
- Global Natural gas price decreased 1.46 USD/MMBtu or 35.62% since the beginning of 2023, according to trading on a contract for difference (CFD) that tracks the benchmark market for this commodity.
- The average price of natural gas in the United States is approximately $2.50-$3.50 per million British thermal units (MMBtu).
- Natural gas prices in Europe vary across countries and regions. As of the latest data, prices range from $6.00-$10.00 per MMBtu.
- Natural gas prices in Asia tend to be higher than in other regions. Prices range from $8.00-$14.00 per MMBtu.
(Source: tradingeconomics, U.S. Energy Information Administration – EIA, Eurostat, Ministry of Economy, Trade, and Industry, Japan)
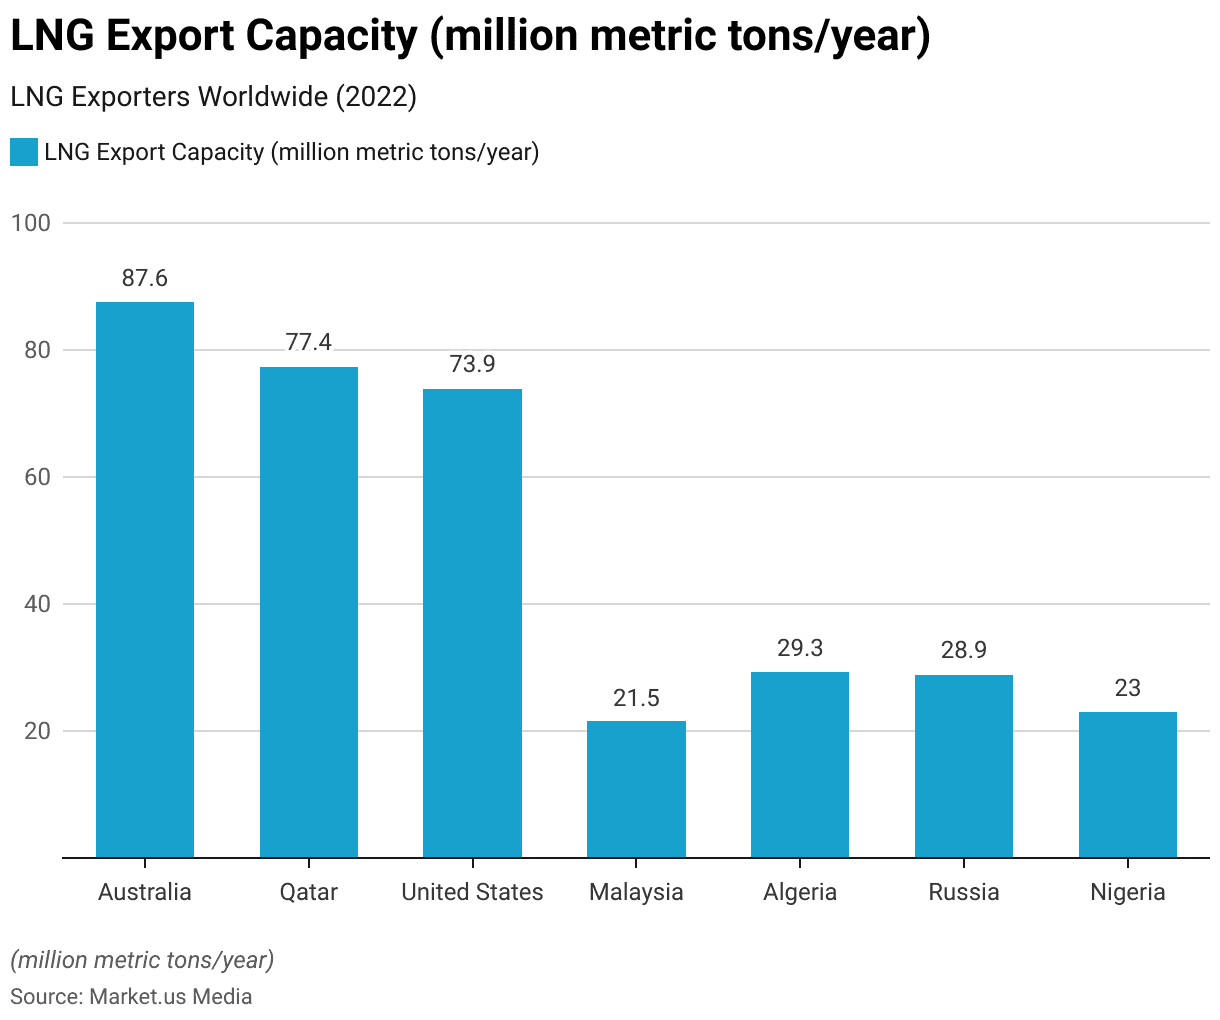
Largest LNG Exporters Worldwide (July 2022)
- Australian liquefied natural gas export terminals had a combined capacity of 87.6 million metric tons per year in 2022.
- The combined capacity of Qatar’s liquefied natural gas export terminals reached 77.4 million metric tons per year as of 2022.
- In 2022, the United States had liquefied natural gas export terminals with a combined capacity of 73.9 million metric tons per year.
- Malaysia’s liquefied natural gas export terminals had a combined capacity of 21.5 million metric tons per year as of 2022.
- As of 2022, Algeria’s liquefied natural gas export terminals had a combined capacity of 29.3 million metric tons per year.
- Russia’s liquefied natural gas export terminals had a combined capacity of 28.9 million metric tons per year as of 2022.
- The combined capacity of Nigeria’s liquefied natural gas export terminals amounted to 23 million metric tons per year in 2022.
(Source: Statista)

Natural Gas Statistics – Infrastructure Statistics
Natural Gas Pipelines
- Global natural gas pipeline network: Over 3.5 million kilometers (2.2 million miles) of pipelines are installed worldwide to transport natural gas.
- Largest natural gas pipeline network: The United States has one of the largest natural gas pipeline networks, with over 485,000 kilometers (301,000 miles) of pipelines.
Liquefied Natural Gas (LNG) Terminals
- Global LNG export capacity: As of 2022, the combined LNG export capacity worldwide is approximately 600 million metric tons per year (mtpa).
- Global LNG import capacity: As of 2022, the combined LNG import capacity worldwide is around 800 million mtpa.
- Largest LNG terminals: The largest LNG terminals are located in Qatar, Australia, and the United States.
Natural Gas Storage
- Global natural gas storage capacity: The total storage capacity for natural gas globally is estimated to be over 400 billion cubic meters (bcm).
- Largest natural gas storage capacity: The United States has the largest natural gas storage capacity, with approximately 100 bcm.
Floating Storage and Regasification Units (FSRUs)
- FSRU count: As of 2021, there are more than 35 FSRUs in operation worldwide.
- FSRU capacity: The average storage capacity of an FSRU is around 170,000 cubic meters (6 million cubic feet) of LNG.
Compressed Natural Gas (CNG) Stations
- CNG station count: The number of CNG stations globally is estimated to be over 25,000.
- Largest CNG vehicle markets: Countries with significant CNG vehicle adoption and infrastructure include Iran, Pakistan, Argentina, India, and Brazil.
CO2 Emission Factor Comparison: Natural Gas vs. Oil and Coal
Carbon Dioxide (CO2) Emissions
- Natural gas has an average CO2 emission factor of 2.2 tonnes per tonne of primary energy consumed.
- This emission factor is approximately 20% less than that of oil and 43% less than that of coal.
Nitrogen Oxide (NOx) Emissions
- Natural gas emits 50% less nitrogen oxides compared to coal.
- Natural gas emits 85% less nitrogen oxides compared to oil.
Sulfur Dioxide (SO2) Emissions
- Natural gas emits 98% less sulfur dioxide compared to coal.
- Natural gas emits 96% less sulfur dioxide compared to oil. (Source: GECF)
Top Companies
China National Petroleum Corporation (CNPC)
- CNPC is the largest natural gas company in the world based on revenue, with US$ 411.7 billion in 2021.
- It produces over 109.37 million cubic meters of natural gas per year in China.
- CNPC is the largest national oil and gas corporation in China, with headquarters in Beijing’s Dongcheng District.
- The company operates in various countries, including Iraq, Uzbekistan, Iran, Malaysia, Syria, Kazakhstan, Uzbekistan, South Sudan, Xinjiang Pipeline, Afghanistan, Russia, New Zealand, and Syria.
Saudi Aramco
- Saudi Aramco is the second-largest natural gas producer globally by revenue.
- The company has the highest natural gas production in the world.
- It generated revenue of US$ 359.5 billion in 2021 and is owned by Saudi Arabia.
- Saudi Aramco is primarily known for its daily oil production, which is approximately 270 billion barrels.
ExxonMobil
- ExxonMobil, based in Irving, Texas, is ranked third among the largest natural gas companies by revenue in 2021.
- It is a multinational American oil and gas company and a major investor in natural gas.
- ExxonMobil acquired XTO Energy, the largest independent natural gas producer in the USA.
- The company earned US$ 285.6 billion in revenue in 2021 and produces 9.97 billion cubic feet of natural gas per day.
Royal Dutch Shell
- Royal Dutch Shell is a British-Dutch multinational oil and natural gas company with headquarters and incorporation in the Netherlands.
- It ranks fourth among the largest natural gas companies by revenue, with US$ 261.5 billion in 2021.
- Shell is Europe’s largest oil and gas company by revenue.
- The company produces 9.3 billion cubic feet of natural gas daily, with 34% of its production coming from East and Southeast Asia, 32% from Europe, and 17% from North America.
- Shell is vertically integrated and operates in all sectors of the oil and gas industry.
BP (British Petroleum)
- BP, headquartered in London, United Kingdom, ranks fourth on the list with revenue of US$ 164.2 billion in 2021.
- It is a multinational oil company and one of the largest natural gas producers globally.
- BP produces 8.7 billion cubic feet of natural gas per day.
- The company operates in over 80 countries and is vertically integrated, involved in all aspects of the oil and gas industry, including production, refining, transportation, distribution, marketing, and petrochemicals.
- BP also has interests in renewable energy, including biofuels, wind power, smart grid technology, and solar technology.
Recent Developments
Expansion of Infrastructure:
- Investment in pipeline infrastructure has increased to facilitate the transportation of natural gas from production sites to distribution centers and end-users.
- New pipeline projects and expansions aim to improve supply reliability, enhance market access, and support the growth of natural gas consumption in various sectors.
Technological Advancements:
- Advancements in drilling and extraction technologies, such as hydraulic fracturing (fracking) and horizontal drilling, have unlocked previously inaccessible natural gas reserves, leading to increased production levels.
- Innovation in liquefied natural gas (LNG) technology has enabled the liquefaction and export of natural gas to global markets, diversifying revenue streams for natural gas producers.
Mergers and Acquisitions:
- Consolidation within the natural gas industry has occurred through mergers and acquisitions, as companies seek to optimize operational efficiencies, reduce costs, and strengthen market positions.
- Major energy companies have acquired smaller players to gain access to strategic assets, expand geographic reach, and diversify product portfolios.
Environmental Regulations and Policy Changes:
- Regulatory changes and environmental policies have influenced the natural gas market, with increased scrutiny on methane emissions, air quality standards, and carbon emissions reduction targets.
- Government incentives and subsidies for renewable energy sources have influenced the competitiveness of natural gas as an energy source in the transition to a low-carbon economy.
Shift in Energy Consumption Patterns:
- Changes in energy consumption patterns have affected natural gas demand, with increased use in power generation, industrial applications, and residential heating.
- Natural gas-fired power plants have become more prevalent due to their relatively low cost, efficiency, and lower carbon emissions compared to coal-fired plants.
Investment in Renewable Natural Gas (RNG):
- Investment in renewable natural gas (RNG) production facilities has increased, utilizing organic waste streams such as agricultural residues, landfill gas, and wastewater to produce biomethane.
- RNG projects contribute to decarbonizing the natural gas supply chain and reducing greenhouse gas emissions by capturing methane emissions from organic waste sources.
Market Volatility and Price Trends:
- Natural gas prices have experienced volatility due to factors such as supply-demand dynamics, weather patterns, geopolitical tensions, and global economic conditions.
- Fluctuations in natural gas prices impact investment decisions, production levels, and profitability for natural gas producers, distributors, and end-users.
Key Takeaways
Natural Gas Statistics – Natural gas is a versatile and widely used source of energy that plays a significant role in various sectors. Its abundance, relatively low cost, and cleaner-burning characteristics compared to other fossil fuels make it an attractive option for power generation, heating, and industrial applications.
As we move towards a more sustainable and cleaner energy future, it is crucial to carefully manage and mitigate these challenges associated with natural gas, while simultaneously exploring and investing in renewable energy sources.
FAQs
Natural gas is a fossil fuel that is formed deep beneath the Earth’s surface. It is primarily composed of methane (CH4) but can also contain small amounts of other hydrocarbons, such as ethane, propane, and butane.
Natural gas has a wide range of uses. It is commonly used for heating homes and buildings, generating electricity, and as a fuel for vehicles. It is also used as a raw material in the production of various products, such as fertilizers, plastics, and chemicals.
The largest producers of natural gas include the United States, Russia, Iran, Canada, and Qatar. As for consumption, the United States, Russia, China, Iran, and Japan are among the top consumers.
Natural gas is typically measured in volume units, such as cubic meters (m³) or cubic feet (ft³). The volume is often converted to energy units, such as British thermal units (BTUs) or gigajoules (GJ), for ease of comparison.
Discuss your needs with our analyst
Please share your requirements with more details so our analyst can check if they can solve your problem(s)