


Introduction
According to Green Chemicals Statistics, Green chemicals, also known as sustainable chemicals, are produced using methods focused on minimizing environmental impact and promoting sustainability.
They are sourced from renewable materials, naturally degrade, and do not harm human health or the environment. These chemicals are used in various sectors, such as manufacturing, agriculture, and everyday consumer products.
Their benefits include protecting the environment, improving safety standards, complying with regulations, and meeting the rising demand for environmentally friendly products. In conclusion, green chemicals are crucial in advancing towards an eco-friendly and sustainable future.
Editor’s Choice
- The global green chemicals market revenue reached USD 111.8 billion in 2023.
- The global green solvents market will reach USD 5.9 billion by 2023.
- Biodegradable bioplastics witnessed significant growth, reaching 1288 tonnes/year in 2023 from 912 tonnes/year in 2018.
- In 2024, in terms of bioplastic production capacity, it is estimated that Asia will emerge as the dominant player, contributing 51.6% of the total production, equivalent to 1605 kg tonnes.
- In 2015, regarding the worldwide consumption of biodegradable polymers, the predominant segment was food packaging, dishes, and cutlery, comprising 44% of the total consumption, indicating a significant reliance on biodegradable materials in the food packaging industry.
- In 2020, the share of green chemistry-marketed products continued to climb, reaching 15.10%, underscoring the expanding demand for and adoption of green chemistry solutions across various industries.
- The latest IPCC report highlights the necessity of achieving net CO2 sequestration to limit global temperature rise below 1.5°C.
- Biodegradable Packaging Market size is expected to be worth around USD 157 Billion by 2032.
Global Green Chemicals Market Overview
Green Chemicals Market Size
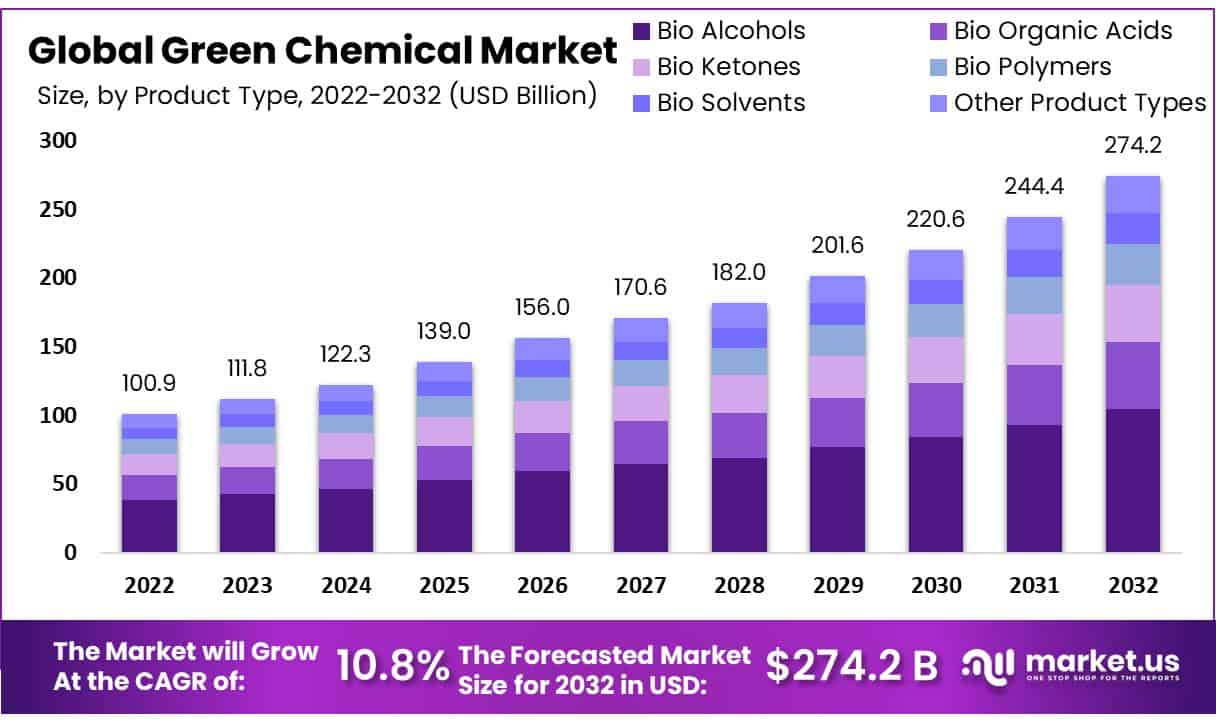
- The global green chemicals market has been experiencing steady growth in revenue over the past decade at a CAGR of 10.8%.
- Starting at USD 100.9 billion in 2022, the market saw an increase to USD 111.8 billion in 2023 and further growth to USD 122.3 billion in 2024.
- The momentum persists with expected revenues of USD 201.6 billion in 2029, surpassing the USD 220.6 billion mark in 2030.
- The growth trajectory remains robust, with projections indicating revenues of USD 244.4 billion in 2031 and USD 274.6 billion in 2032.

Global Green Solvents Market Size
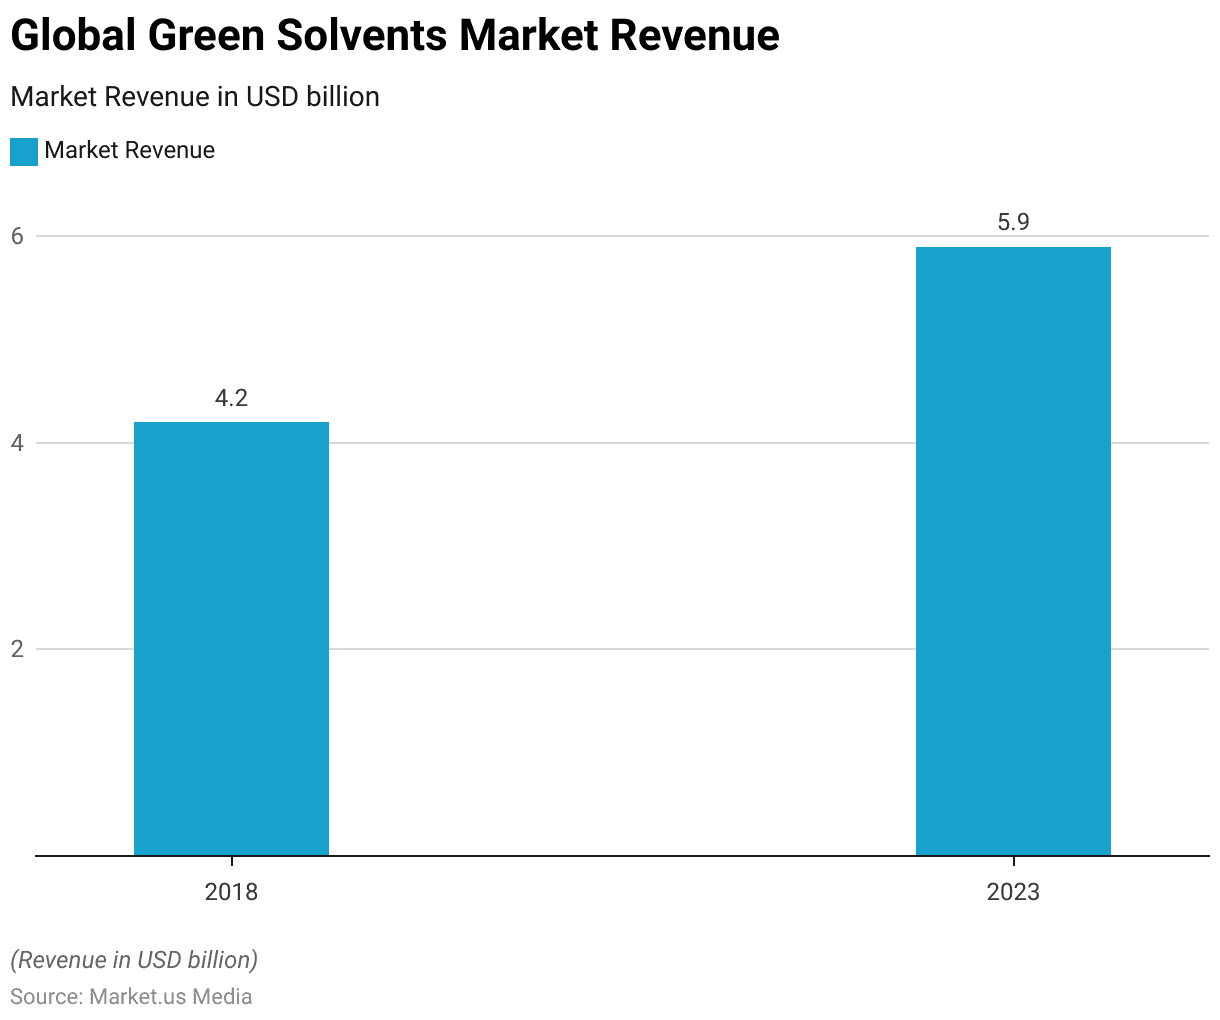
- The global green solvents market has witnessed notable growth in revenue between 2018 and 2023.
- Beginning at USD 4.2 billion in 2018, the market experienced a steady increase, reaching USD 5.9 billion by 2023.
- This growth trajectory reflects the rising demand for environmentally friendly solvents across various industries.

Bioplastics Statistics
Global Production of Bioplastics
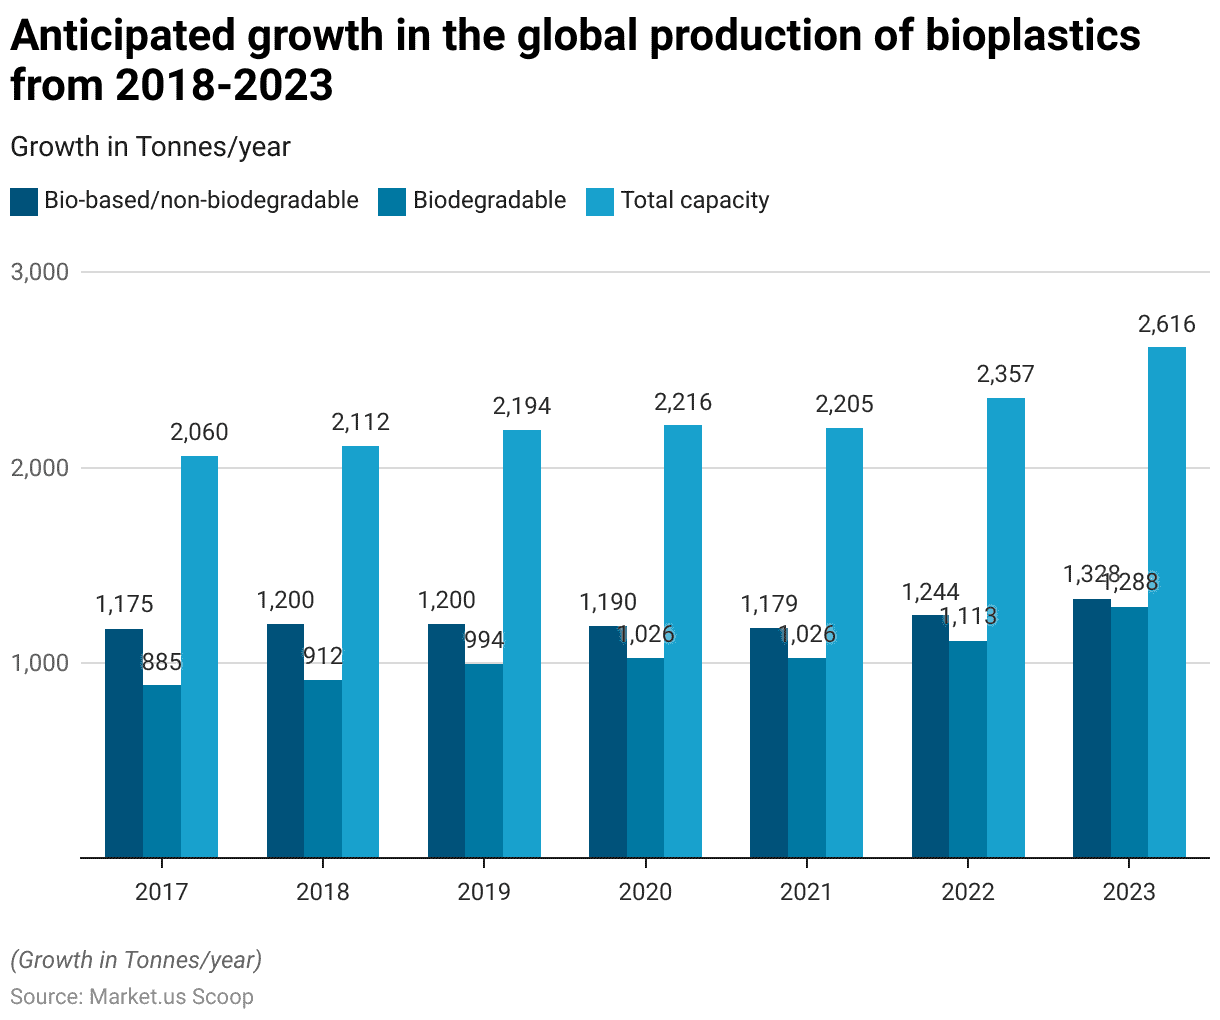
- Between 2018 and 2023, the global production of bioplastics is expected to demonstrate substantial growth across bio-based, non-biodegradable, and biodegradable categories.
- In 2018, the total capacity stood at 2112 tonnes/year, with 1200 tonnes/year of bio-based non-biodegradable and 912 tonnes/year of biodegradable bioplastics.
- This trend continued as the total capacity increased to 2616 tonnes/year by 2023.
- Notably, the production of bio-based non-biodegradable bioplastics rose from 1200 tonnes/year in 2018 to 1328 tonnes/year in 2023, indicating a consistent upward trajectory.
- Similarly, biodegradable bioplastics witnessed significant growth, reaching 1288 tonnes/year in 2023 from 912 tonnes/year in 2018.
Production Capacities of Bioplastics – By Material Type
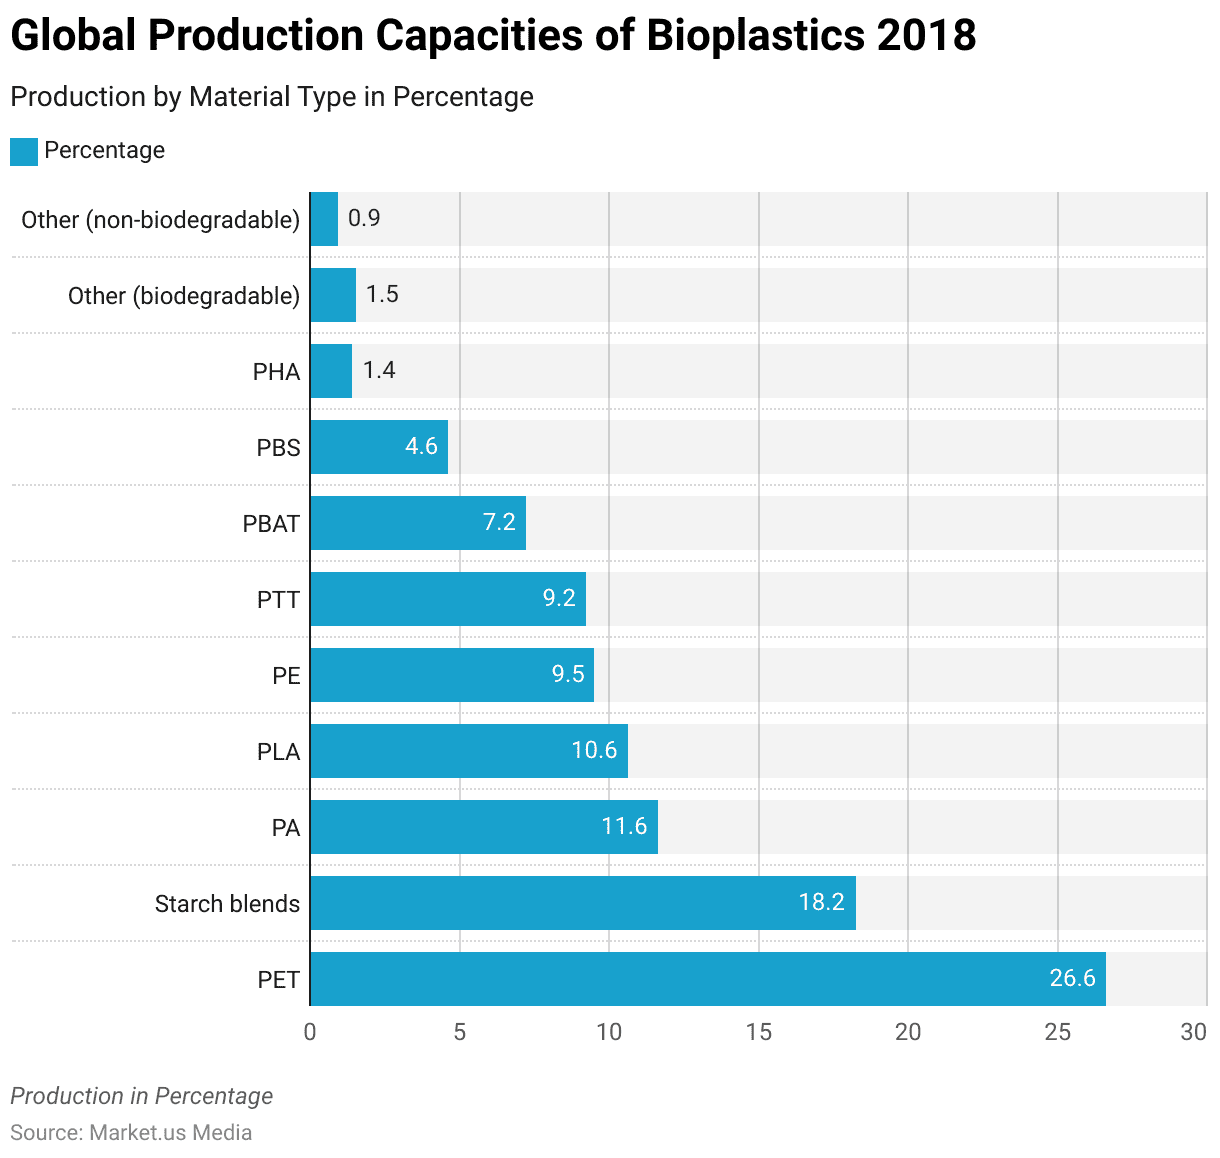
- In 2018, the global production capacities of bioplastics varied across different material types.
- PET constituted the largest share at 26.6%, followed by starch blends at 18.2%.
- Polyamide (PA) accounted for 11.6% of the production capacities, while Polylactic Acid (PLA) and Polyethylene (PE) contributed 10.6% and 9.5%, respectively.
- Other notable contributors included Polytrimethylene Terephthalate (PTT) at 9.2% and Polybutylene Adipate Terephthalate (PBAT) at 7.2%. Polybutylene Succinate (PBS) and Polyhydroxyalkanoates (PHA) represented smaller shares at 4.6% and 1.4%, respectively.
Global Bioplastics Production Capacities – by Region
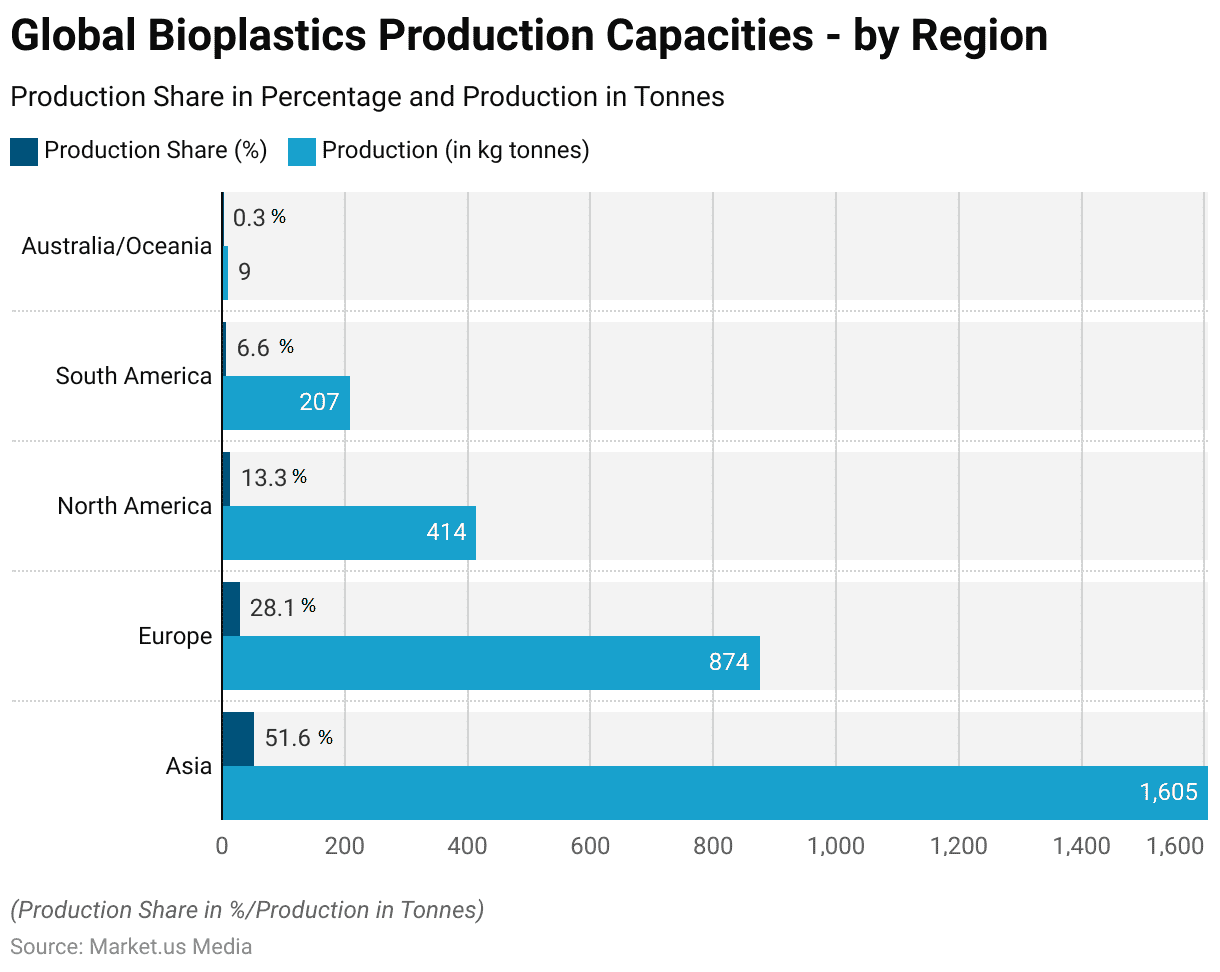
- In 2024, bioplastics production capacities varied across regions, reflecting a dynamic global landscape.
- Asia emerged as the dominant player, contributing 51.6% of the total production, equivalent to 1605 kg tonnes.
- Following closely, Europe accounted for 28.1% of production, representing 874 kg tonnes.
- North America and South America trailed behind, with production shares of 13.3% and 6.6%, respectively, translating to 414 kg tonnes and 207 kg tonnes.
- Australia/Oceania contributed minimally, holding just 0.3% of the production share, amounting to 9 kg tonnes.
Bio-polymer Statistics
Bio-polymer Production
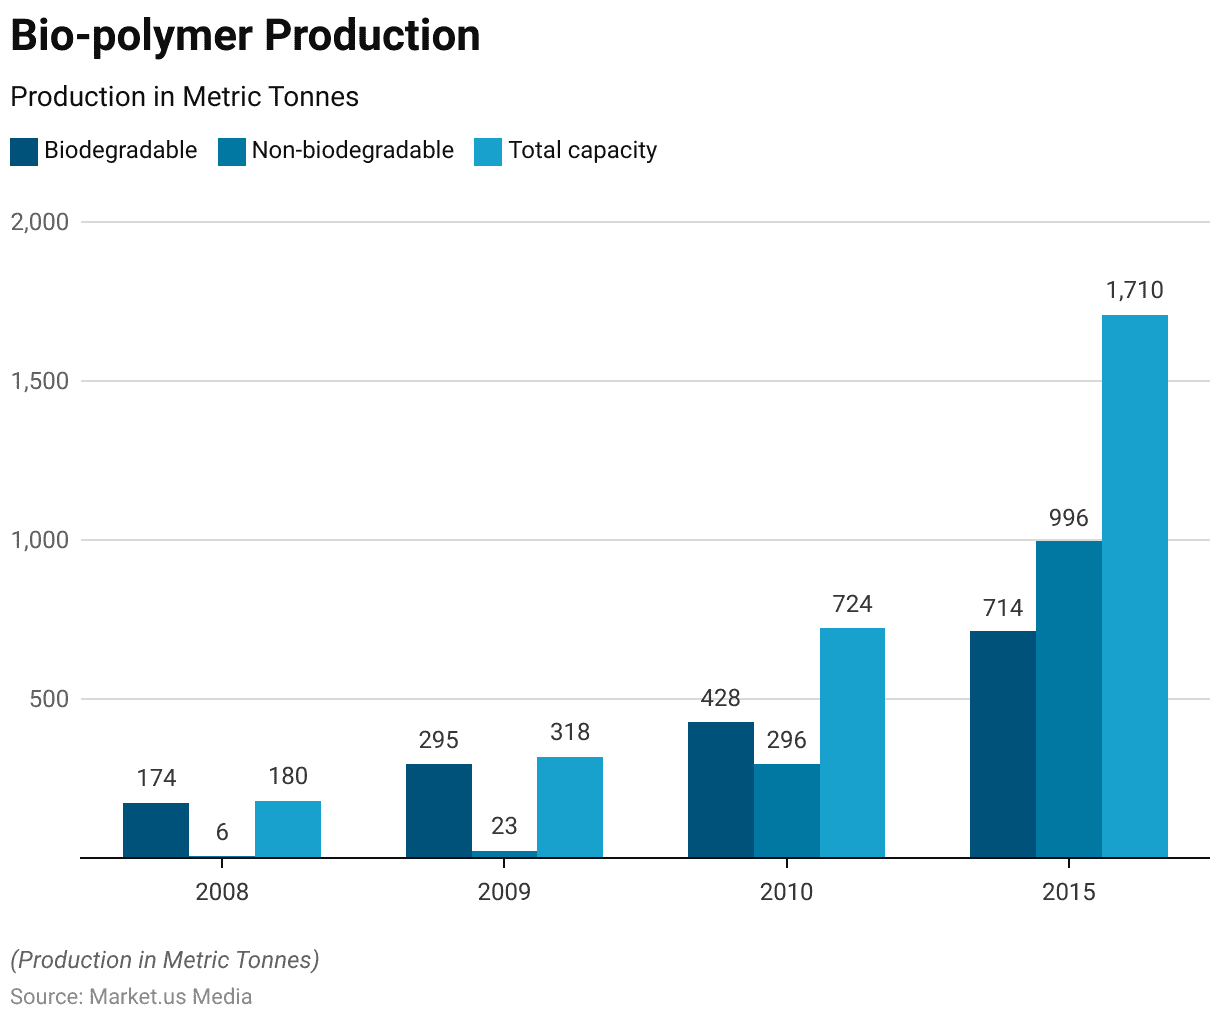
- Between 2008 and 2015, bio-polymer production capacities exhibited significant growth, reflecting increasing demand and technological advancements in bioplastics.
- In 2008, the total capacity stood at 180 metric tonnes, with 174 metric tonnes allocated to biodegradable (including not bio-based) and a mere six metric tonnes to non-biodegradable (bio-based) materials.
- By 2015, the total capacity had surged to 1710 metric tonnes, showcasing a remarkable increase.
- During this period, the production capacities of both biodegradable and non-biodegradable bio-polymers experienced substantial growth, with biodegradable capacities reaching 714 metric tonnes and non-biodegradable capacities totaling 996 metric tonnes.
Consumption of Biodegradable Polymers – By End Use
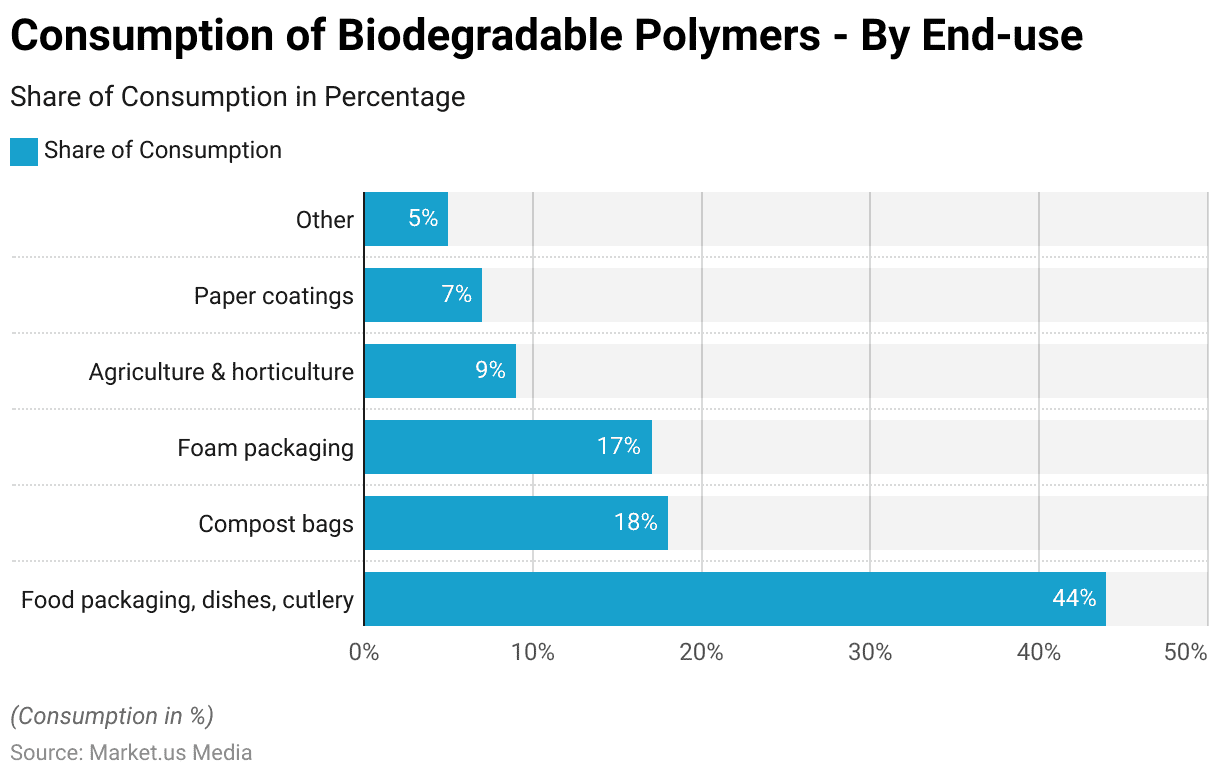
- In 2015, the worldwide consumption of biodegradable polymers exhibited a diverse distribution across various end uses.
- The predominant segment was food packaging, dishes, and cutlery, comprising 44% of the total consumption, indicating a significant reliance on biodegradable materials in the food packaging industry.
- Compost bags followed closely, representing 18% of the consumption share, emphasizing the growing adoption of environmentally friendly alternatives in waste management practices.
- Foam packaging accounted for 17% of consumption, reflecting its usage in diverse packaging applications.
- Agriculture and horticulture constituted 9% of consumption, indicating a notable utilization in these sectors for applications such as mulching films and plant pots.
- Paper coatings represented 7% of consumption, suggesting a niche yet noteworthy presence in enhancing the sustainability of paper products.
Adoption of Green Chemistry Marketed Products
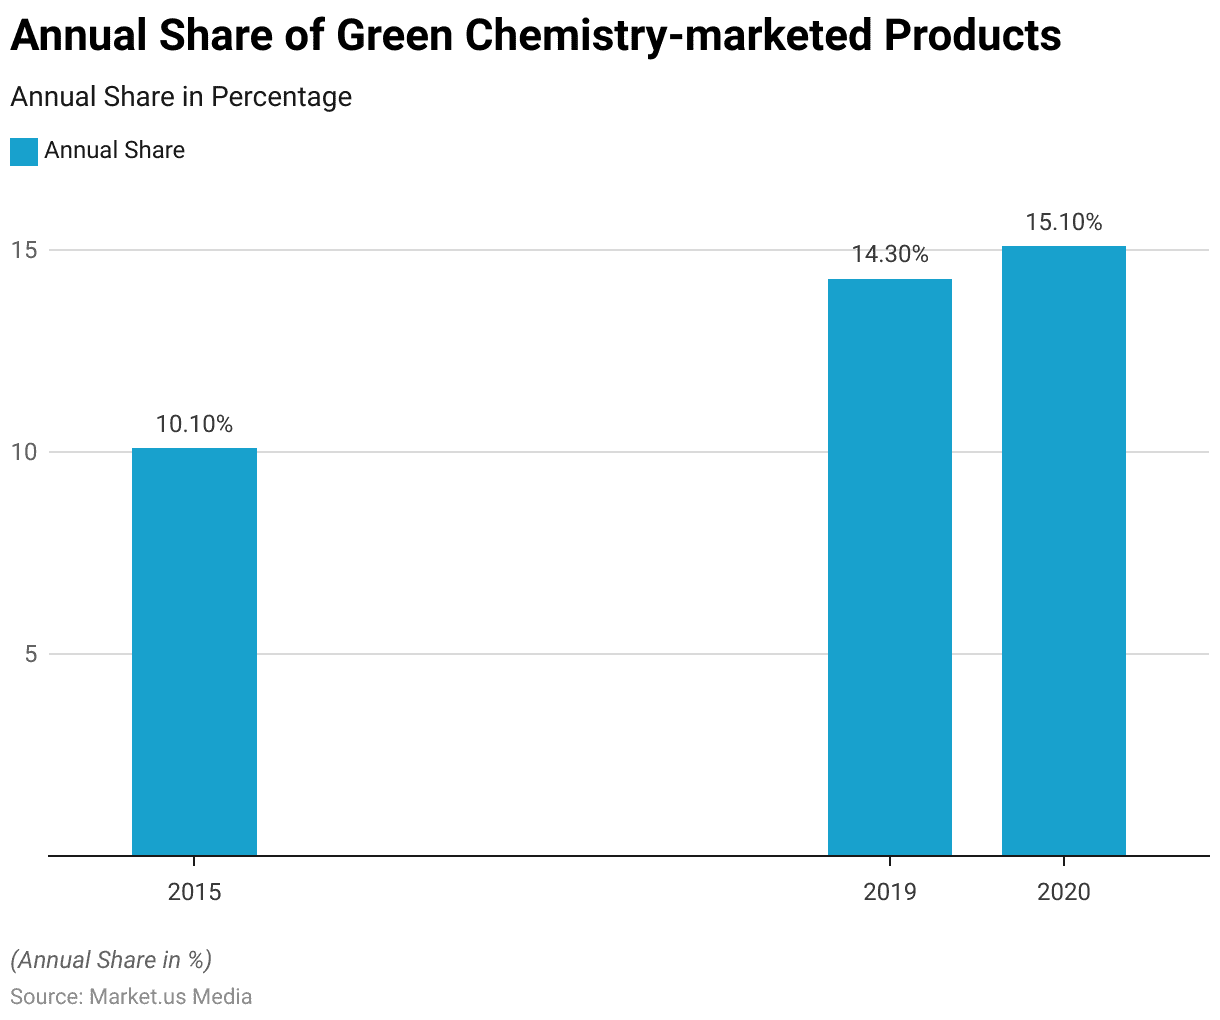
- The annual share of green chemistry-marketed products has steadily increased over the years.
- In 2015, it stood at 10.10%, indicating a notable presence of environmentally friendly products.
- By 2019, this share had risen to 14.30%, reflecting a growing trend towards sustainability and eco-conscious consumer choices.
- In 2020, the share continued to climb, reaching 15.10%, underscoring the expanding demand and adoption of green chemistry solutions across various industries.

Top Priority Policy Recommendations for Advancing Green and Sustainable Chemistry
- Based on their perceived medium to very high impact, the ranking of top-priority policy recommendations reveals several critical initiatives for advancing green and sustainable chemistry.
- The phase-out or restriction of chemical substances is the most common, cited by 95% of respondents.
- Following closely are federal and state tax policies incentivizing green and sustainable products, with 87.13% ranking this as highly impactful.
- Additionally, there is significant support for expediting new chemical review processes for green chemistry and establishing specific federal purchasing specifications for such products.
- Increasing federal funding for research and development in green chemistry and sustainable products is also viewed favorably by 80% of respondents.
Biorefinery Platforms for Chemicals Production
CO2‐Platform
- The latest IPCC report highlights the necessity of achieving net CO2 sequestration to limit global temperature rise below 1.5°C.
- Bio-based chemicals and materials, particularly those derived from fermentation processes using biogenic CO2, offer a promising solution. However, this requires increased collaboration across sectors and exploration of industrial symbiosis opportunities.
- The conversion of CO2 into intermediates is already being addressed in research projects like Carbon4PUR.
- Methanol, a key chemical globally, is traditionally produced from synthesis gas. A low-carbon alternative involves making hydrogen from water electrolysis using low-carbon electricity, followed by hydrogenation of CO2.
- 2011 Carbon Recycling International (CRI) launched the “George Olah Renewable Methanol Plant” to highlight Iceland’s geothermal energy potential. Initially designed for 1,300 metric tons capacity, the 7.1 million euro plant now produces 4,000 tons of renewable methanol annually.
Chemical Transformation Products from Sugars
- Sugars are crucial intermediates in chemically catalyzed processes, undergoing various reactions to produce valuable products such as sorbitol, furfural, glucaric acid, hydroxymethylfurfural, and levulinic acid.
- For example, sorbitol and xylitol are widely produced sugar alcohols, with sorbitol’s demand projected to exceed 2 million tonnes in 2018. Sorbitol serves as a food ingredient and precursor for bio-based plastics like isosorbide.
- Another illustration is furfural production from cellulose or hemicellulose in biomass, where high temperatures and mineral acids drive hemicellulose hydrolysis followed by xylose dehydration.
- This process operates at an industrial scale, with annual production volumes surpassing 360,000 tonnes.
Critical Initiatives for Green Infrastructure
Inflation Reduction Act (IRA)
- President Biden signed the Inflation Reduction Act (IRA) into law in August 2022, primarily targeting inflation. However, it has also transformed the landscape for green investment in the US, prompting a competitive pursuit of opportunities.
- Hydrogen production processes emitting less than 0.45 kilograms of CO2e per kilogram of hydrogen receive the full base credit. Those emitting between 0.45 to 1.5 kilograms of CO2e receive one-third of this credit.
- However, credit amounts vary based on the technology. Standard credits can reach up to $85 per tonne of CO2 permanently stored and $60 per tonne for CO2 used in EOR.
- For DAC, credits increase to $180 per tonne of CO2 permanently stored and $130 per tonne for used CO2. Provisions supporting local economies and workers will also significantly impact project tax credits.
US Superfund Excise Tax
- Comparing regulatory models across jurisdictions presents challenges, but chemical companies must consider each region’s tax and legal frameworks as critical factors for global investment strategies.
- While the Inflation Reduction Act (IRA) primarily offers incentives, other legislation, like the reinstated Superfund Excise Tax, is a regulatory stick. This tax, relevant to industries including chemicals, gas, and petroleum, applies to many taxable chemicals and hazardous substances.
- Unlike the previous version, the threshold for taxation now stands at 20% of listed chemicals in a substance.
Discuss your needs with our analyst
Please share your requirements with more details so our analyst can check if they can solve your problem(s)