


Table of Contents
- Introduction
- Editor’s Choice
- Global Biogas Market Overview
- Biogas Composition Statistics
- Global Biogas Production Statistics
- Global Biogas Demand for Direct Use Statistics
- Consumption Rates of Biogas Across Various Devices
- Cost of Biogas Production Technologies Statistics
- Successful Biogas Projects Statistics
- Recent Developments
- Conclusion
- FAQs
Introduction
Biogas Statistics: Biogas, seen as an eco-friendly energy choice, results from the breakdown of organic matter without oxygen, releasing methane and carbon dioxide.
This process, termed anaerobic digestion, utilizes various sources like agricultural leftovers, food scraps, and animal waste.
Once collected, biogas is refined and can generate electricity, heat, or power vehicles. Its advantages include effective waste management, decreased emissions, and enhanced energy independence.
Despite challenges such as ensuring a steady supply of raw materials and building necessary infrastructure, biogas remains a promising solution for sustainable energy needs. Continuous progress and supportive policies are crucial for its widespread adoption.

Editor’s Choice
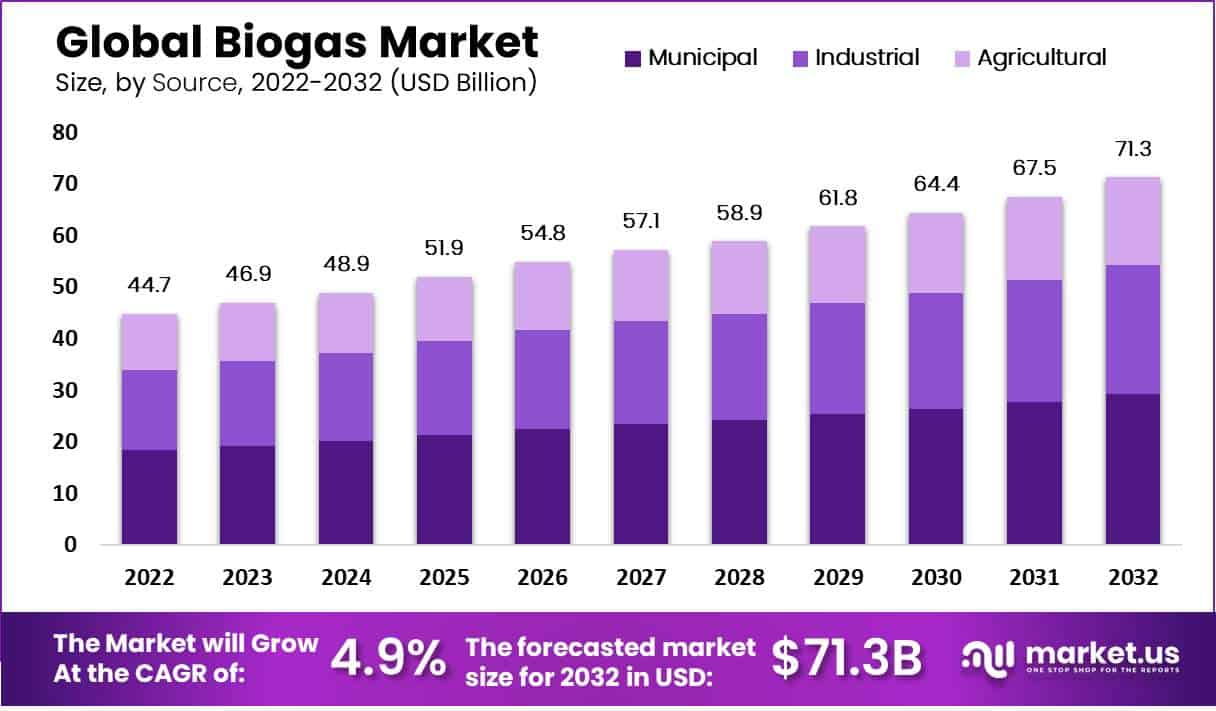
- The global biogas market revenue will exceed USD 70 billion by 2032.
- In 2022, municipal revenue accounted for USD 18.3 billion of the total biogas market revenue of USD 44.7 billion.
- Among applications, electricity generation holds the largest market share, accounting for 30% of the total market.
- Biogas generated from household waste typically contains 50–60% CH4 and 38–34% CO2. While sludge-derived biogas may have a higher CH4 content ranging from 60–75% and a lower CO2 percentage of 33–19%.
- Global biogas production reached 1.46 exajoules by the close of 2020.
- Europe emerged as the leading producer, contributing 776,905 terajoules (TJ). Approximately 20 billion cubic meters (bcm) of biogas to the global supply.
- The Advanced biodigester had a capital cost of 7.3 USD/Mbtu and maintenance/operating costs of 0.6 USD/Mbtu in 2018.
Global Biogas Market Overview
Global Biogas Market Size Statistics
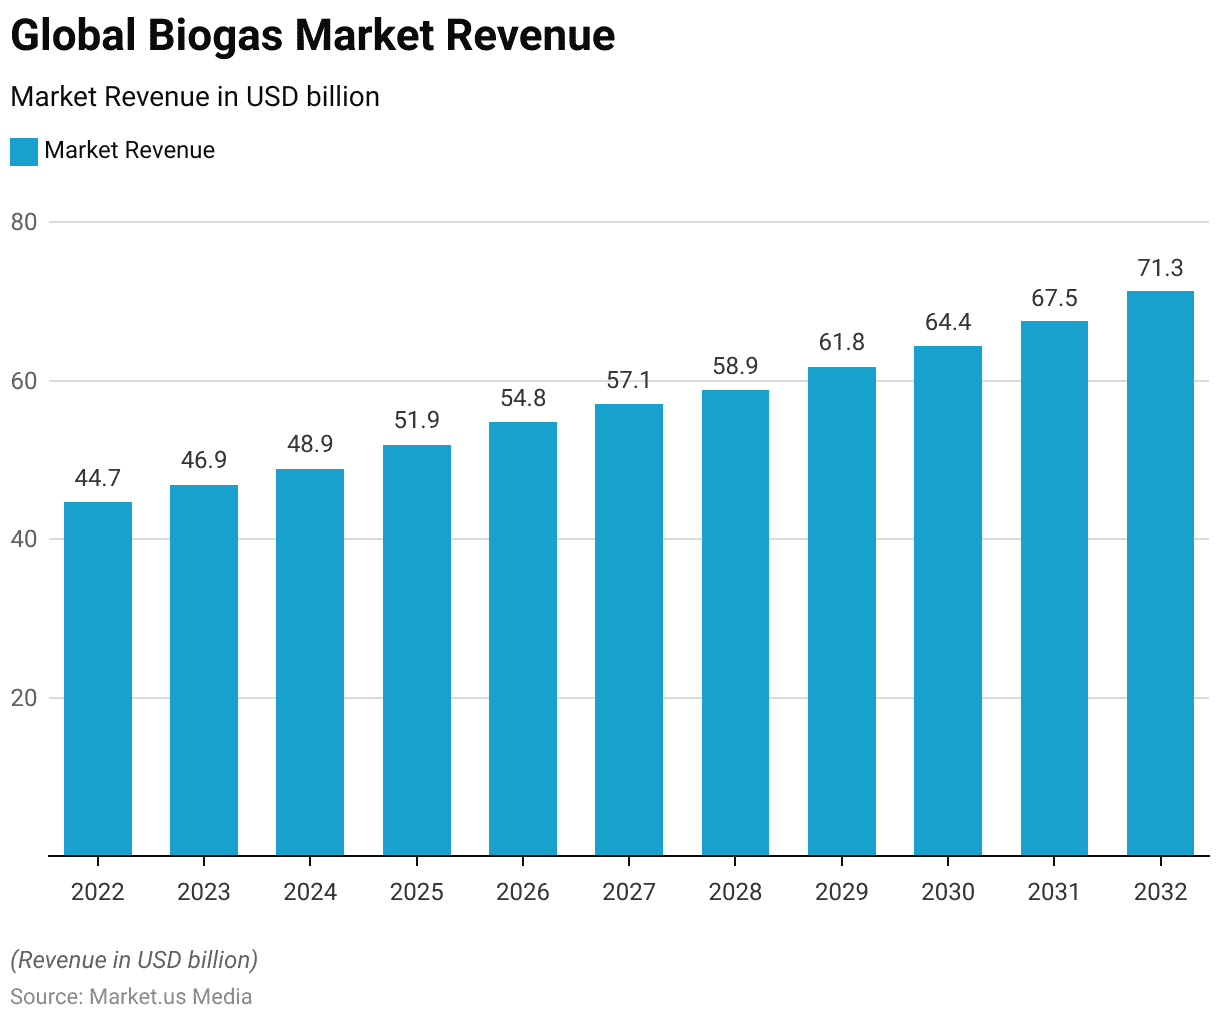
- The revenue of the global biogas market has shown a consistent upward trend over the years at a CAGR of 4.9%, with steady growth projected into the foreseeable future.
- In 2022, the market revenue stood at USD 44.7 billion, which increased to USD 46.9 billion in 2023, reflecting a positive trajectory.
- The momentum continued in 2024, with revenue reaching USD 48.9 billion, and further expansion is anticipated in subsequent years.
- By 2025, revenue is forecasted to reach USD 51.9 billion, followed by increments to USD 54.8 billion in 2026 and USD 57.1 billion in 2027.
- The market is expected to maintain upward momentum, surpassing USD 60 billion by 2029 and USD 67.5 billion by 2031.
- Projections indicate robust growth prospects, with revenue anticipated to exceed USD 70 billion by 2032. Reflecting biogas solutions’ increasing significance and global adoption.
(Source: Market.us)

Biogas Market Size – By Source Statistics
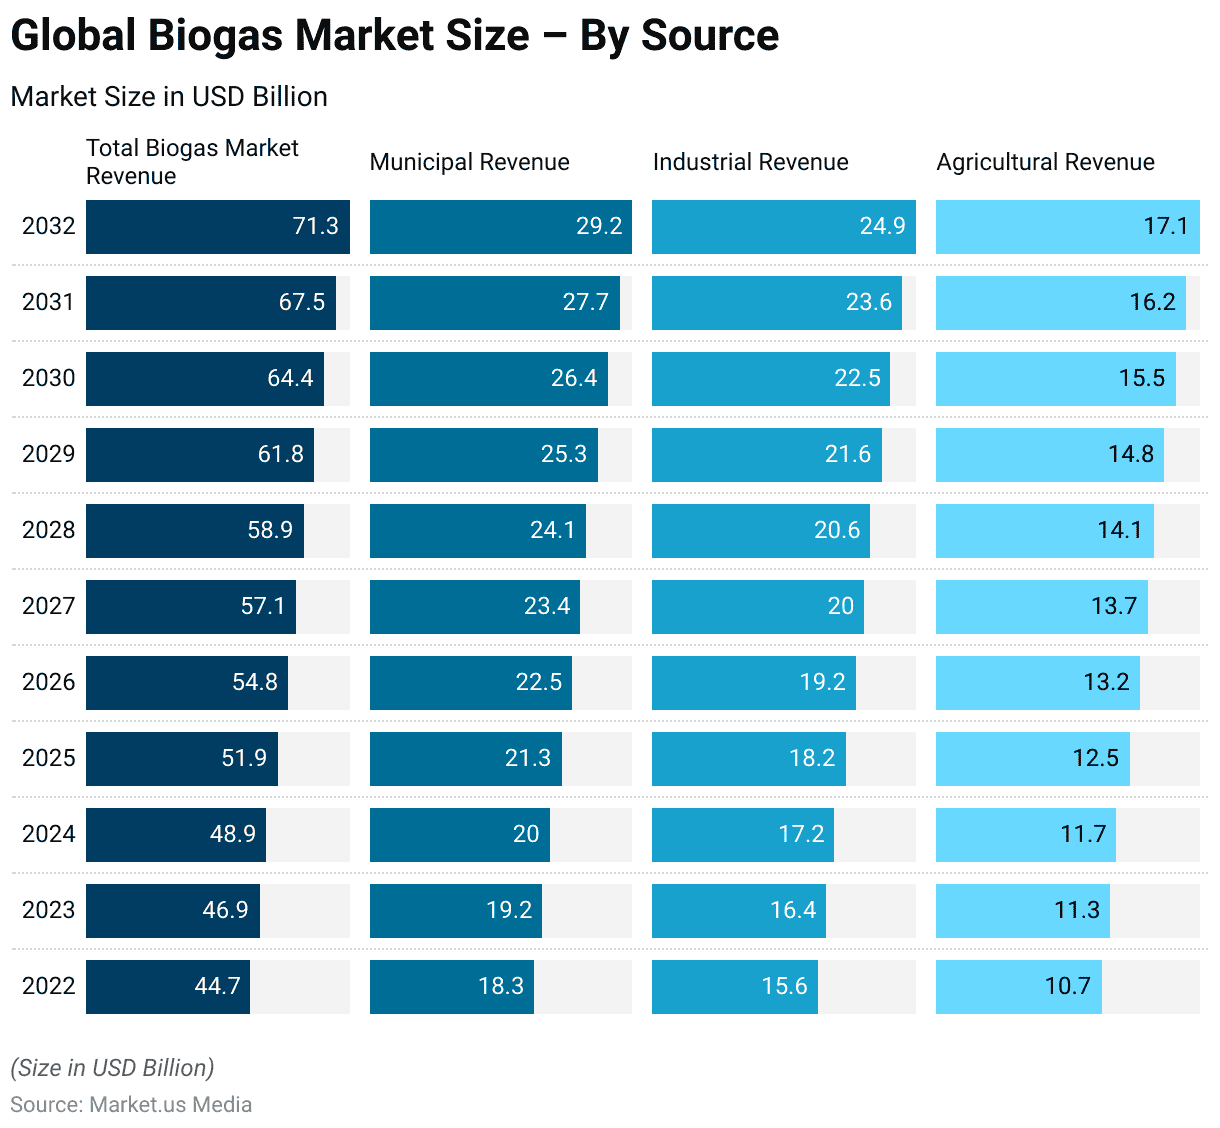
- The global biogas market exhibits a diversified landscape, with revenue streams from various sources.
- Analysis reveals that the municipal sector commands a significant portion of the market, consistently contributing substantial yearly revenue.
- In 2022, municipal revenue accounted for USD 18.3 billion of the total biogas market revenue of USD 44.7 billion.
- Over the following years, this sector continued to expand, reaching USD 29.2 billion by 2032.
- Similarly, the industrial and agricultural segments also play pivotal roles in driving market growth.
- Starting at USD 15.6 billion in 2022, industrial revenue climbed steadily to USD 24.9 billion by 2032. While agricultural revenue increased from USD 10.7 billion to USD 17.1 billion during the same period.
- These trends underscore the multifaceted nature of the global biogas market. With contributions from municipal, industrial, and agricultural sectors collectively propelling its growth trajectory.
(Source: Market.us)

Global Biogas Market Share – By Application Statistics
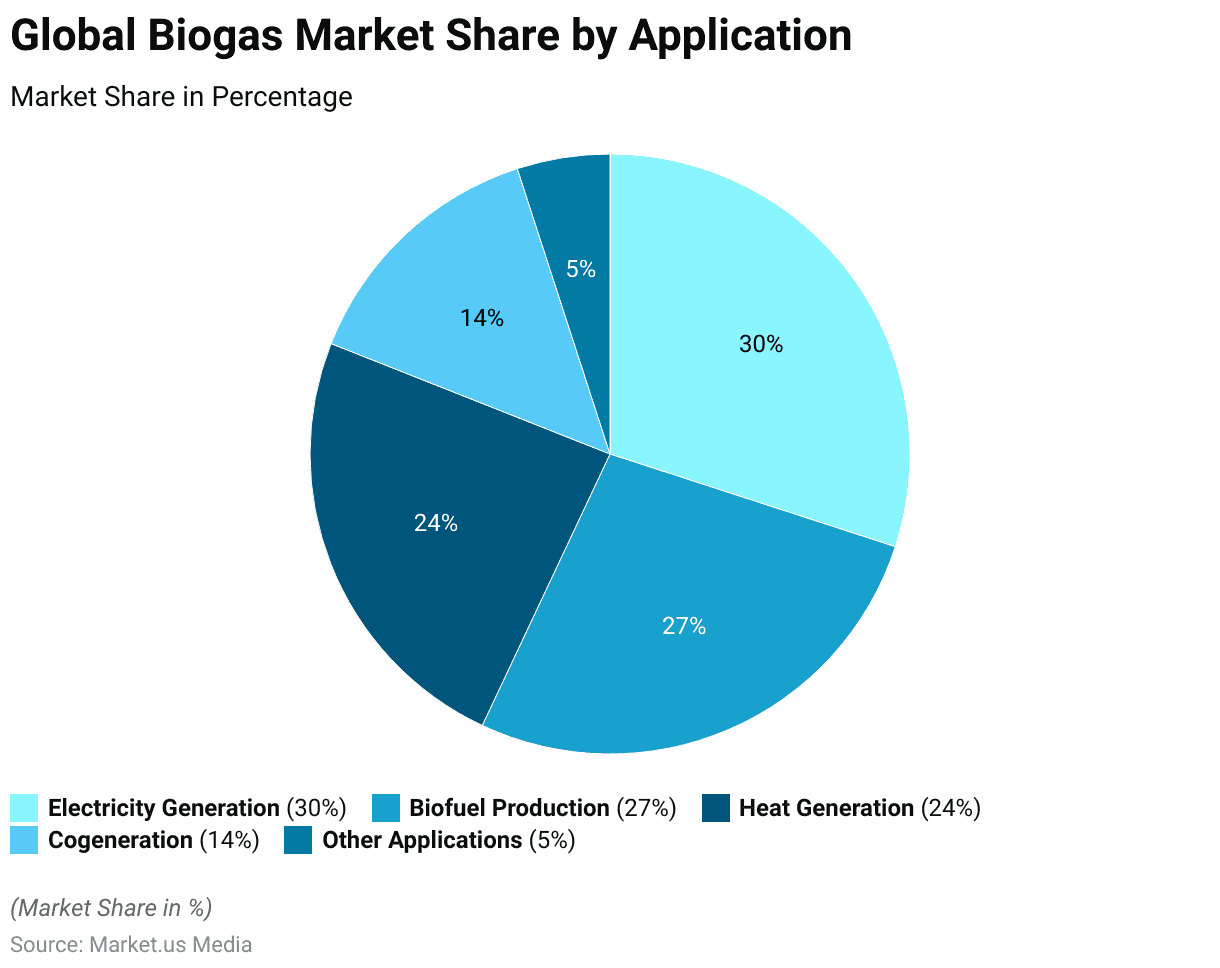
- The global biogas market is segmented by application, with various sectors contributing to its overall composition.
- Among these, electricity generation holds the largest market share, accounting for 30%.
- Fuel production is closely behind, capturing 27% of the market share.
- Heat generation represents another significant portion, comprising 24% of the market, while cogeneration accounts for 14%.
- Other applications, which encompass a range of uses beyond the primary categories, make up the remaining 5% of the market share.
- These proportions underscore the diverse array of biogas applications. Electricity generation, biofuel production, heat generation, cogeneration, and other applications collectively shaping the landscape of the global biogas market.
(Source: Market.us)
Biogas Composition Statistics
- The composition of biogas varies depending on the raw materials used in its generation.
- Household waste, sludge, agricultural residues, and agri-food industry waste are familiar sources. Each contributes distinct proportions of methane (CH4), carbon dioxide (CO2), nitrogen (N2), oxygen (O2), and water vapor (H2O).
- For instance, biogas generated from household waste typically contains 50–60% CH4 and 38–34% CO2. While sludge-derived biogas may have a higher CH4 content ranging from 60–75% and a lower CO2 percentage of 33–19%.
- Similarly, agricultural residues and agri-food industry waste yield biogas compositions with CH4 levels ranging from 60–75% and 68%, respectively, with varying CO2 concentrations.
- Other components such as nitrogen, oxygen, water vapor, hydrogen sulfide (H2S), ammonia (NH3), and aromatics contribute to the overall composition, albeit in smaller quantities.
- These nuances highlight the importance of selecting appropriate feedstock and process optimization for biogas production. Reflecting this renewable energy’s diverse sources and potential applications.
(Source: Pubmed)
Global Biogas Production Statistics
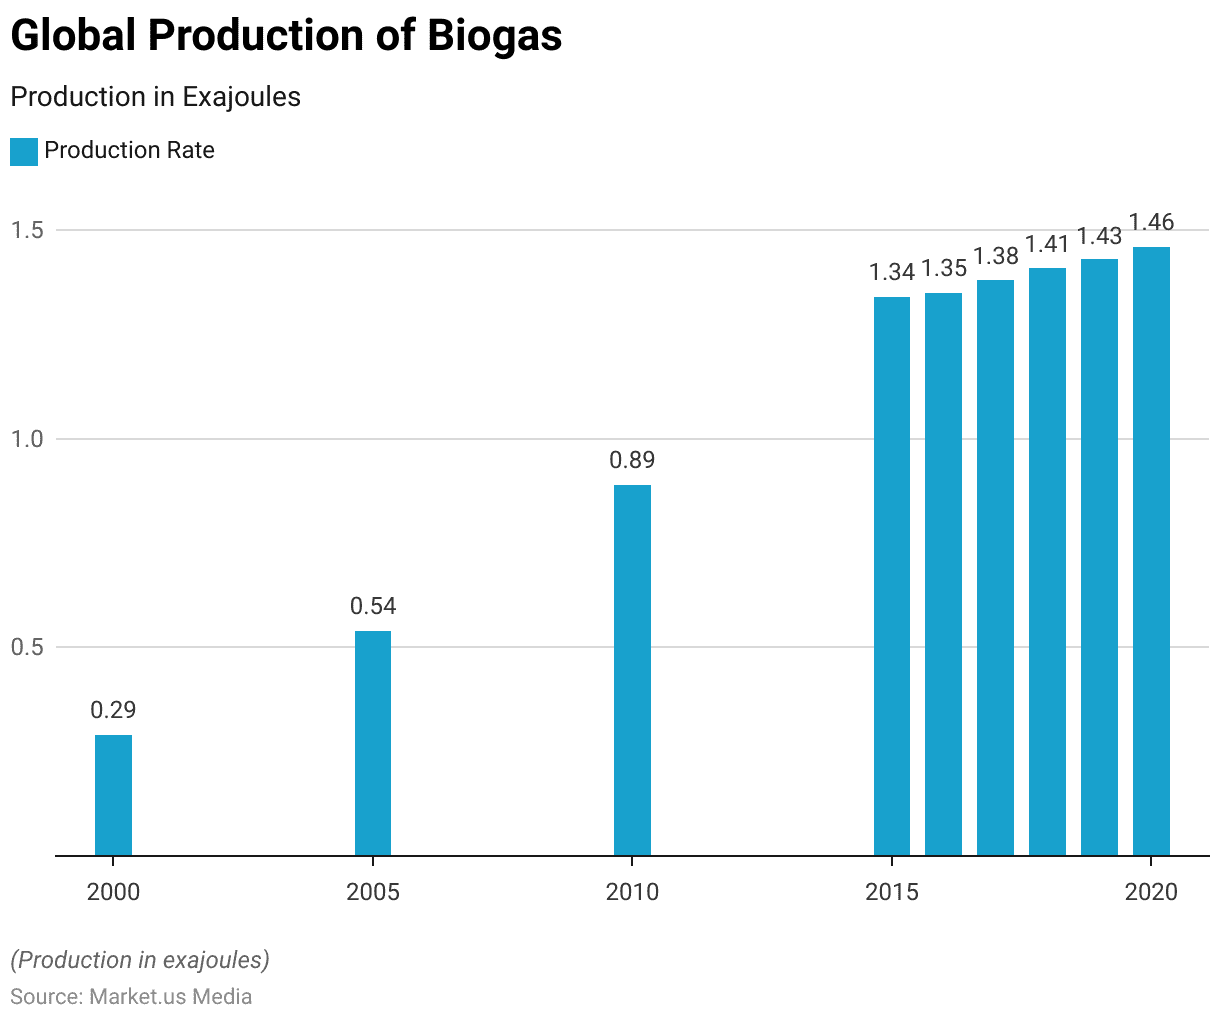
- The production of biogas has steadily increased over the past two decades, showcasing a notable upward trajectory.
- Beginning at 0.29 exajoules in 2000, the production gradually rose, reaching 0.54 exajoules by 2005.
- Subsequently, there was a discernible acceleration in growth. With production escalating to 0.89 exajoules in 2010 and further to 1.34 exajoules by 2015.
- This momentum continued unabated, as evidenced by the consecutive annual increments: 1.35 exajoules in 2016, 1.38 exajoules in 2017, and 1.41 exajoules in 2018.
- The upward trend persisted, culminating in a production figure of 1.43 exajoules in 2019 and reaching 1.46 exajoules by the close of 2020.
- Such consistent growth underscores the increasing significance and adoption of biogas as a renewable energy source. Aligning with global efforts toward sustainability and mitigating climate change.
(Source: Statista)

Biogas Production Volume – By Continent Statistics
- In 2020, biogas supply across continents exhibited significant variations in production volumes, reflecting diverse regional dynamics and levels of adoption.
- Europe emerged as the leading producer, contributing 776,905 terajoules (TJ) or approximately 20 billion cubic meters (bcm) of biogas to the global supply.
- Following closely behind, Asia accounted for 469,175 TJ (12 bcm), showcasing a notable presence in the biogas market.
- The Americas also demonstrated considerable production levels, generating 192,243 TJ (5 bcm) of biogas during the same period.
- In contrast, Oceania‘s contribution was comparatively modest, producing 20,093 TJ (1 bcm).
- Notably, Africa reported lower production volumes, with 369 TJ of biogas supply. Indicating the potential for growth and development in the continent’s biogas sector.
- These regional disparities underscore the varying degrees of infrastructure, policy support, and market maturity influencing biogas production across continents.
(Source: World Bioenergy Association)

Global Biogas Demand for Direct Use Statistics
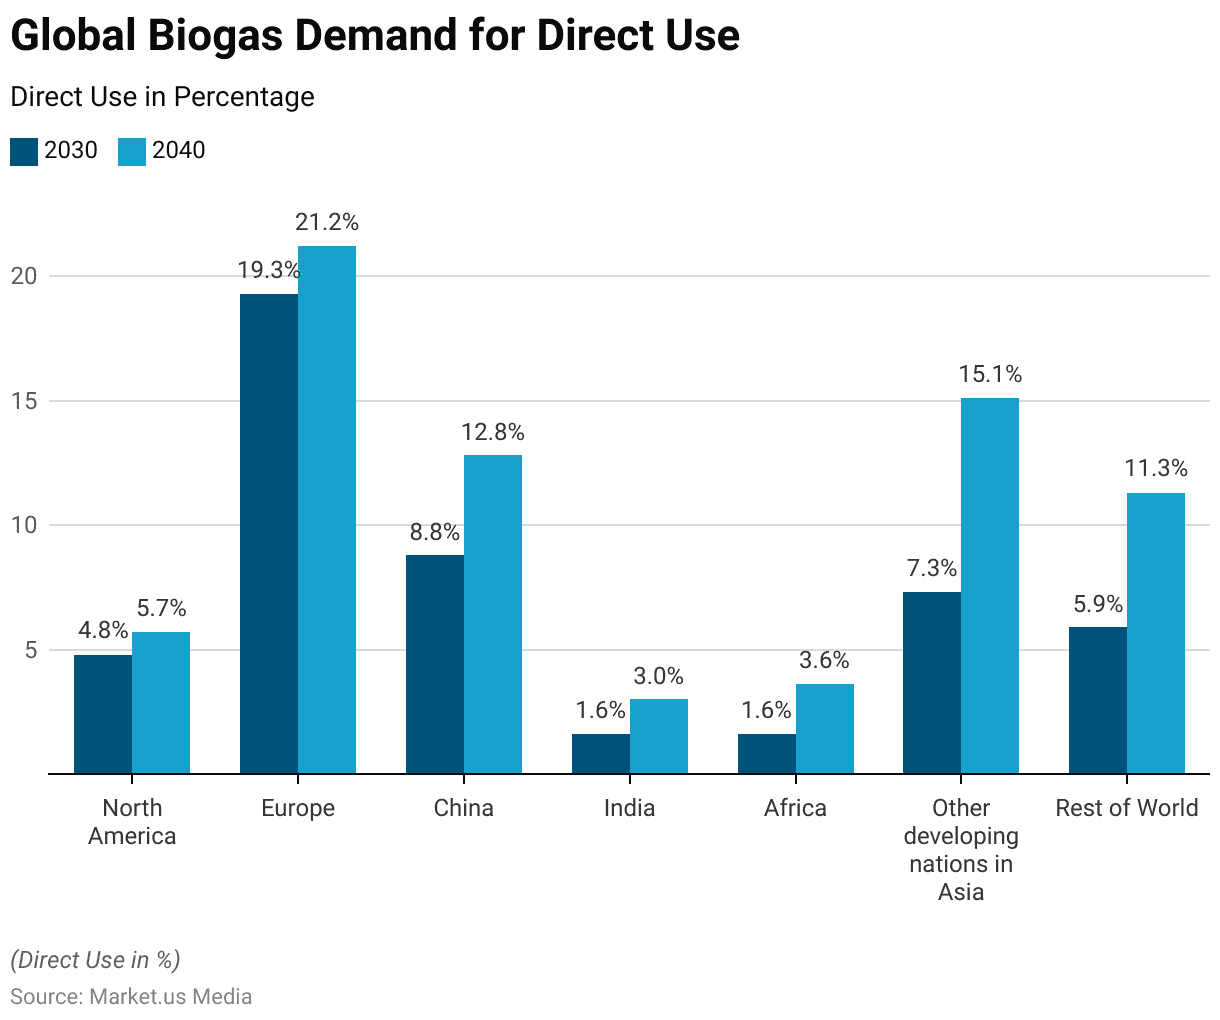
- In the Stated Policies Scenario, from 2030 to 2040, global demand for biogas for direct use exhibits a notable upward trend across regions.
- Europe leads the demand, with anticipated percentages rising from 19.3% in 2030 to 21.2% by 2040, reflecting the region’s commitment to renewable energy sources and sustainability initiatives.
- China and India also show substantial growth in demand, with China’s expected percentage increasing from 8.8% to 12.8% and India’s from 1.6% to 3%, respectively. Highlighting the significant contributions of these populous nations to the biogas market.
- Other developing nations in Asia are projected to experience a substantial surge in demand, from 7.3% to 15.1%. Indicating increasing adoption and investment in biogas infrastructure and technologies across the region.
- North America and the Rest of the World also demonstrate steady growth. With demand percentages rising from 4.8% to 5.7% and 5.9% to 11.3%, respectively.
- Africa emerges as a promising market, with demand expected to double from 1.6% to 3.6%. Reflecting growing awareness and investment in biogas projects to address the continent’s energy access and sustainability challenges.
- The projections underscore the global momentum towards embracing biogas as a viable and sustainable energy source across diverse geographical regions.
(Source: International Energy Agency)
Consumption Rates of Biogas Across Various Devices
- The consumption rates of biogas vary significantly across a range of devices, highlighting the versatility of this renewable energy source.
- For household burners, consumption typically falls between 200 and 450 liters per hour (L/h), catering to domestic cooking and heating needs.
- In industrial settings, burners require larger quantities, with consumption rates ranging from 1000 to 3000 L/h, reflecting the higher energy demands of manufacturing processes.
- Refrigerators consume biogas at 30 to 75 L/h depending on their size and outside temperature, ensuring efficient cooling operations.
- Gas lamps, equivalent to 60-watt bulbs, consume biogas at a moderate rate of 120 to 150 L/h, providing illumination with minimal environmental impact.
- Biogas/diesel engines, commonly used in transportation and power generation, require 420 L/h per brake horsepower (bhp) for efficient operation.
- Generating 1 kilowatt-hour (kWh) of electricity from biogas/diesel mixtures demands a consumption rate of 700 L/h, highlighting the energy-intensive nature of electricity production.
- Finally, plastic molding presses, used in manufacturing processes, consume biogas at 140 L/h for molding 15 grams of plastic in 100 units. Underscoring the diverse applications and efficiency of biogas utilization across various sectors.
(Source: Sustainable Sanitation, Water Management & Agriculture)

Cost of Biogas Production Technologies Statistics
On a Commercial Scale
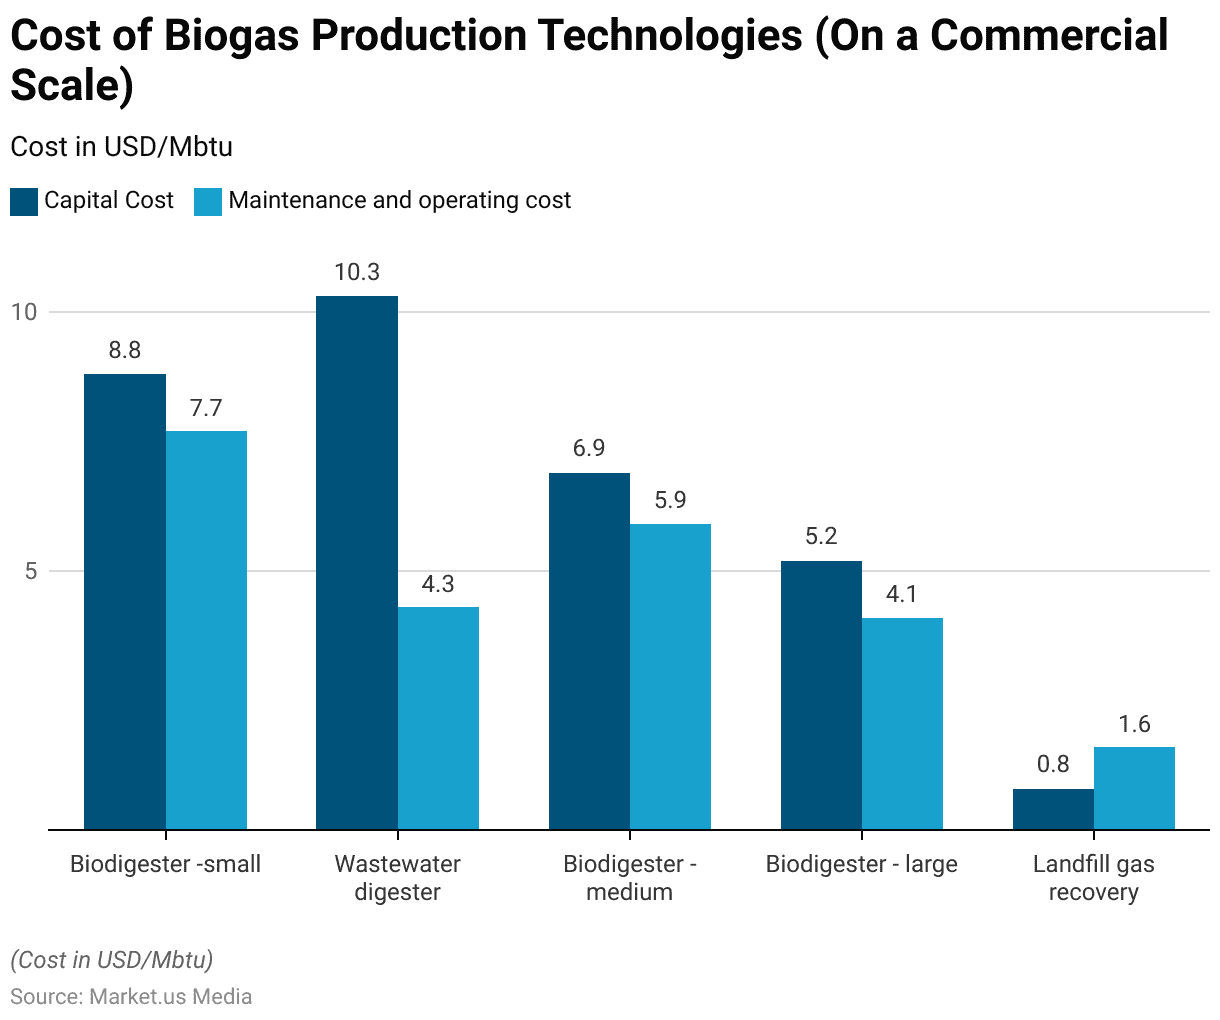
- In 2018, the average costs of biogas production technologies per unit of energy produced. Excluding feedstock expenses, varied across different facilities operating on a commercial scale.
- Biodigesters, available in small, medium, and large sizes, exhibited varying capital and maintenance/operating costs.
- Small biodigesters had a capital cost of 8.8 USD/Mbtu and maintenance/operating costs of 7.7 USD/Mbtu.
- In comparison, medium and large biodigesters offered more cost-effective solutions with capital costs of 6.9 USD/Mbtu and 5.2 USD/Mbtu. Respectively, maintenance/operating costs of 5.9 USD/Mbtu and 4.1 USD/Mbtu, respectively.
- Wastewater digesters, another biogas production technology, had a capital cost of 10.3 USD/Mbtu and maintenance/operating costs of 4.3 USD/Mbtu.
- Additionally, landfill gas recovery systems emerged as the most cost-efficient option. With a minimal capital cost of 0.8 USD/Mbtu and maintenance/operating costs of 1.6 USD/Mbtu, highlighting their economic viability for biogas production on a commercial scale.
- These cost structures underscore the importance of considering capital investment and ongoing operational expenses in assessing the economic feasibility of biogas production technologies.
(Source: International Energy Agency)
On a Household Scale
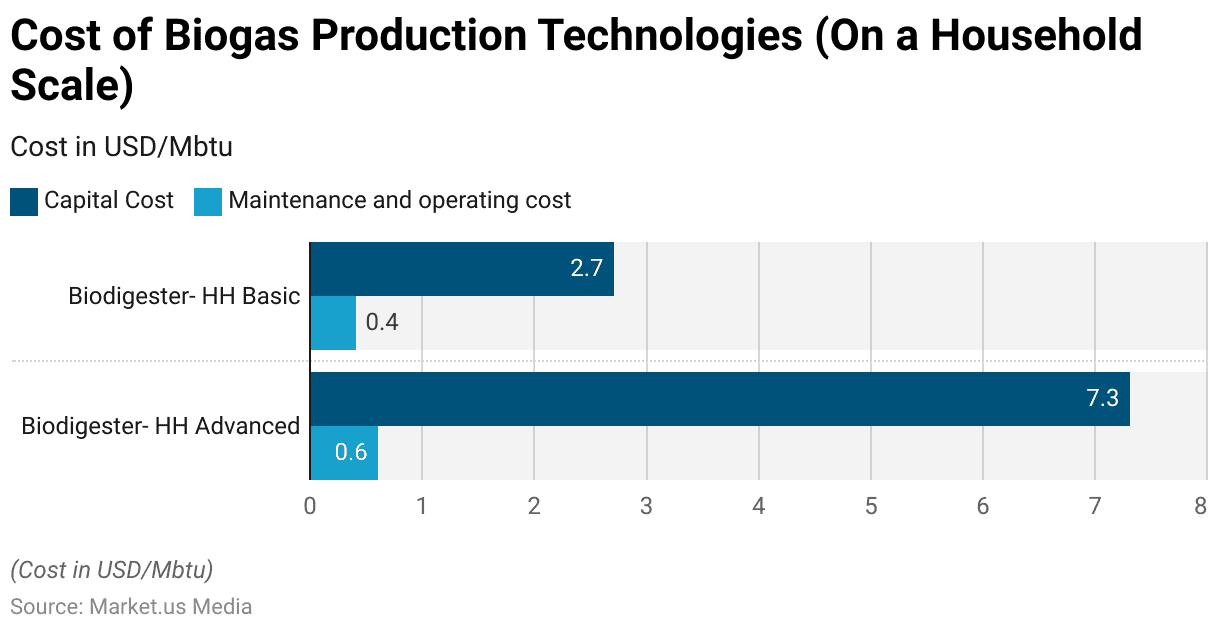
- In 2018, average costs for biogas production technologies on a household scale, excluding feedstock expenses, varied between different facilities.
- Two main types of biodigesters, categorized as “Advanced” and “Basic,” were available for household use.
- The Advanced biodigester had a capital cost of 7.3 USD/Mbtu and maintenance/operating costs of 0.6 USD/Mbtu.
- In contrast, the Basic biodigester offered a more cost-effective solution with a lower capital cost of 2.7 USD/Mbtu and maintenance/operating costs of 0.4 USD/Mbtu.
- These figures highlight the affordability and accessibility of biodigesters for households seeking to produce biogas for their energy needs.
- The lower maintenance and operating costs associated with the Basic biodigester further enhance its appeal as a sustainable and economical energy solution for residential use.
(Source: International Energy Agency)

Successful Biogas Projects Statistics
R. S. Dairy Farm, V.P.O.
- In April 2012, R. S. Dairy Farm, located in V.P.O. – Bahadurpur, District – Ropar, Punjab, initiated a biogas project aimed at supplying biogas to 75 households within the village.
- The project, implemented for 15.00 lakh rupees, was solely financed by Dilbar Singh, the proprietor of the dairy farm. As it did not receive any central financial assistance from the Ministry of New and Renewable Energy (MNRE).
- With 150 cattle available on the dairy farm, approximately 3000 kilograms of dung were collected daily to fuel the biogas production process.
- Currently, 70 gas connections are operational, serving most households, while only two families have individual biogas plants.
- Biogas is supplied to households for two hours each, three times a day, during the morning, noon, and evening periods, catering to the community’s energy needs through sustainable means.
(Source: IITD)
Tongeren
- The biogas plant in Tongeren is a pioneering endeavor within the province of Limburg, representing one of the most expansive projects in Belgium.
- Situated within the industrial precinct of Tongeren, this facility is engineered to process maize silage. Constituting 80% of its feedstock, alongside industrial residues like glycerine from biodiesel production and various organic waste materials, comprising the remaining 20%.
- To uphold robust sustainability standards and achieve an annual energy crop output of 35,000 tons, local farmers have been enlisted to supply maize sourced within a 20-kilometer radius of the plant.
- Given the elevated dry matter content inherent in the feedstock, the plant’s constructors opted to incorporate a pre-treatment hydrolysis digester. Specifically the EUCO Paraphrase, streamlining the digestion process and enhancing overall efficiency.
(Source: European Biogas Association)
Oudon Biogaz Plant
- Oudon Biogaz aims to manage the significant volume of manure, exceeding 140,000 tons, generated by its 72 farms sustainably.
- Approximately 85% comprises agricultural by-products like slurry, manure, and straw. The goal is to convert these resources into 55 GWh of biomethane annually, enough to power 9,000 families in the Craon area.
- Additionally, the plant may utilize cereal waste and local agro-industry by-products for energy production.
- By injecting the biogas into the national grid, the project aims to prevent around 14,000 tons of CO2 emissions, equivalent to 5,500 cars annually.
- The digestate produced will be utilized across 7,700 hectares of farmland, reducing reliance on chemical fertilizers.
- This initiative represents 25% of biogas production in the Mayenne Department and creates employment opportunities by adding ten jobs.
(Source: Biomass Magazine)
Indonesia Domestic Biogas Program (IDBP)
- The Indonesia Domestic Biogas Program (IDBP) is a collaborative initiative promoting renewable energy by installing small-scale household biodigester systems known as Biogas Rumah (BIRU) across approximately 11 provinces since its inception in 2009.
- The primary objective of the IDBP is to stimulate the market for domestic biogas.
- As of the conclusion of 2019, the program has successfully established approximately 24,767 units of BIRU across households, varying in scale from 4 m3 to 12 m3.
(Source: Indonesia Domestic Biogas Program)
Microferm
- Microferm is an anaerobic digestion (AD) technology developed by HoSt specifically for farmers seeking to manage manure efficiently.
- With electrical capacities ranging from 60 to 150 kW, Microferm generates electricity and heat.
- Additionally, the biogas produced can be upgraded for grid injection using technology from Bright Biomethane, a subsidiary of Host.
- The project benefits from the Dutch SDE+ subsidy, providing a fixed fee per Nm3 of biomethane for 12 years.
- The Merselo Microferm plant, which digests 100% manure, experienced a smooth start-up, with biomethane injection into the natural gas grid just one and a half weeks after filling the digester.
- The biogas upgrading system at the plant has a capacity of 40 Nm3 per hour of biomethane.
(Source: Bioenergy International)
Recent Developments
New Project Launches:
- In 2024, Brightmark Energy launched a new biogas project in Florida, aiming to convert organic waste into renewable natural gas to power vehicles and reduce greenhouse gas emissions.
- Ameresco, a leading renewable energy company, announced the completion of a biogas upgrading facility in California, furthering the adoption of renewable energy sources in the state.
Investment:
- In 2024, Ørsted, a renewable energy company, announced plans to invest $30 million in building a new biogas plant in Denmark, aiming to expand its renewable energy portfolio.
Major Acquisitions:
- In 2021, Eni SpA acquired an Italian biogas company, as part of its strategy to enhance its presence in the biogas sector.
- Greenlane Renewables Inc. signed contracts worth USD 10.2 million for renewable natural gas projects in the U.S., demonstrating active market expansion and investment.
Government Initiatives and Regulatory Support:
- The European Union set a target to increase the share of renewable energy in the transportation sector to 14% by 2030, driving investments in biogas infrastructure and production.
- The Renewable Fuel Standard (RFS) in the United States mandates the use of renewable fuels, including biogas, in transportation, providing incentives for biogas production and utilization.
Technological Advancements and Innovation:
- Companies are investing in research and development to improve biogas production efficiency and explore new feedstock sources, such as agricultural residues and organic waste streams.
- Advancements in biogas upgrading technologies, such as membrane separation and pressure swing adsorption, are enabling the production of high-purity biomethane for injection into natural gas pipelines.
Conclusion
Biogas Statistics – In summary, biogas is a promising renewable energy source, deriving from organic waste like manure, agricultural leftovers, and food scraps.
Its production not only aids in waste management and cutting greenhouse gas emissions but also offers a sustainable energy option.
Biogas finds applications in electricity generation, heating, and as a vehicle fuel, serving diverse sectors. Moreover, it fosters rural development and job growth and boosts energy security by reducing reliance on fossil fuels.
Despite challenges like feedstock availability and technology limitations, continued innovation, policy backing, and investment can unlock biogas’s full potential in steering us toward a more sustainable, low-carbon energy future.
FAQs
Biogas is a renewable energy source produced through the anaerobic digestion of organic materials such as agricultural waste, food waste, animal manure, and sewage. It primarily consists of methane (CH4), carbon dioxide (CO2), and trace amounts of other gases.
Biogas is produced through a natural process called anaerobic digestion, where microorganisms break down organic matter in the absence of oxygen. This process occurs in sealed anaerobic digesters, tanks, or ponds, where organic materials decompose and release methane gas.
Common feedstocks for biogas production include organic waste from households, agriculture, and industries. This includes food scraps, crop residues, animal manure, wastewater sludge, and energy crops such as corn or sugarcane.
Biogas can be used for various applications, including electricity generation, heat production, and vehicle fuel.
Biogas plays a crucial role in the transition to renewable energy by providing a reliable source of clean energy that can be integrated into existing energy infrastructure. It contributes to diversifying the energy mix, reducing dependence on fossil fuels, and achieving sustainability goals.
Discuss your needs with our analyst
Please share your requirements with more details so our analyst can check if they can solve your problem(s)