


Table of Contents
- Introduction
- Editor’s Choice
- Green Chemicals Market Statistics
- Bioplastics Statistics
- Green Chemicals By Bio-polymer Statistics
- Adoption of Green Chemicals Marketed Products Statistics
- Top Priority Policy Recommendations for Green Chemicals Statistics
- Biorefinery Platforms for Chemicals Production
- Critical Initiatives for Green Chemicals Infrastructure Statistics
- Recent Developments
- Conclusion
- FAQs
Introduction
Green Chemicals Statistics: Green chemicals are also known as sustainable chemicals. They are produced using methods focused on minimizing environmental impact and promoting sustainability.
They are sourced from renewable materials, naturally degrade, and do not harm human health or the environment.
These chemicals are used in various sectors, such as manufacturing, agriculture, and everyday consumer products.
Their benefits include protecting the environment, and improving safety standards. Complying with regulations, and meeting the rising demand for environmentally friendly products. In conclusion, green chemicals are crucial in advancing towards an eco-friendly and sustainable future.
Editor’s Choice
- The global green chemicals market revenue reached USD 111.8 billion in 2023.
- The global green solvents market will reach USD 5.9 billion by 2023.
- Biodegradable bioplastics witnessed significant growth, reaching 1288 tonnes/year in 2023 from 912 tonnes/year in 2018.
- In 2024, in terms of bioplastic production capacity, it is estimated that Asia Willemerge is the dominant player. Contributing 51.6% of the total production, equivalent to 1605 kg tonnes.
- In 2015, regarding the worldwide consumption of biodegradable polymers, the predominant segment was food packaging, dishes, and cutlery, comprising 44% of the total consumption, indicating a significant reliance on biodegradable materials in the food packaging industry.
- In 2020, the share of green chemistry-marketed products continued to climb, reaching 15.10%. Underscoring the expanding demand for and adoption of green chemistry solutions across various industries.
- The latest IPCC report highlights the necessity of achieving net CO2 sequestration to limit global temperature rise below 1.5°C.
- Biodegradable Packaging Market size is expected to be worth around USD 157 Billion by 2032.
Green Chemicals Market Statistics
Green Chemicals Market Size Statistics
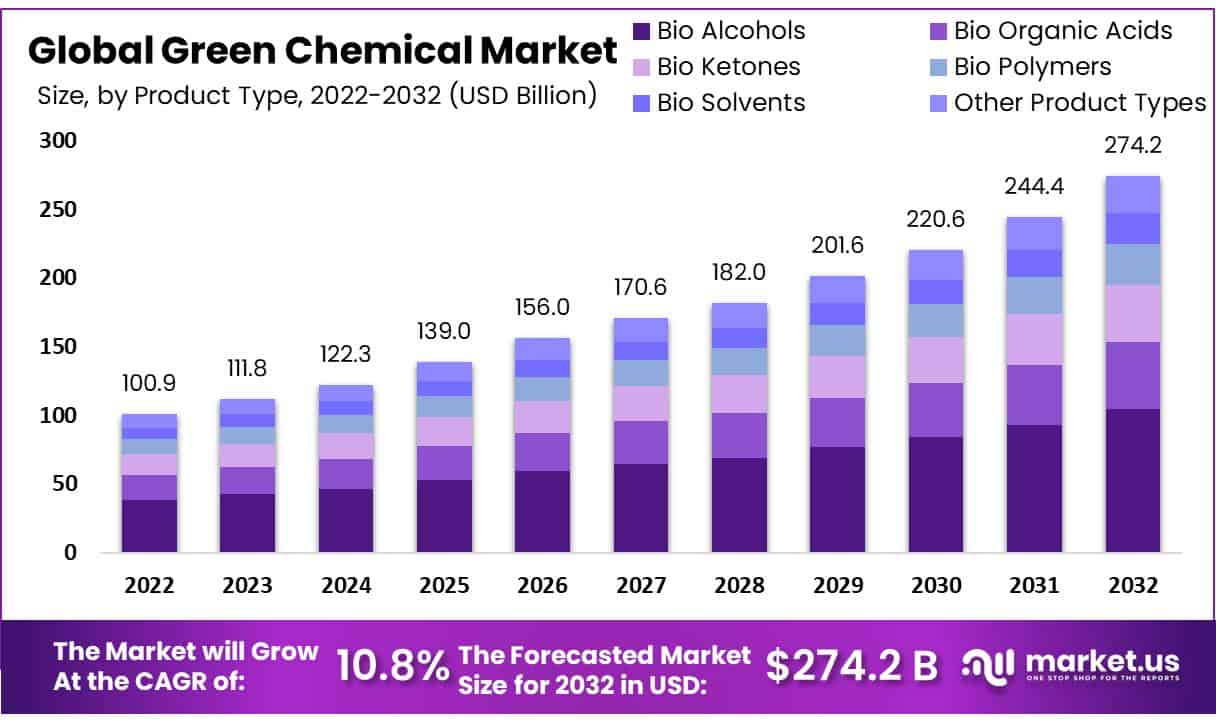
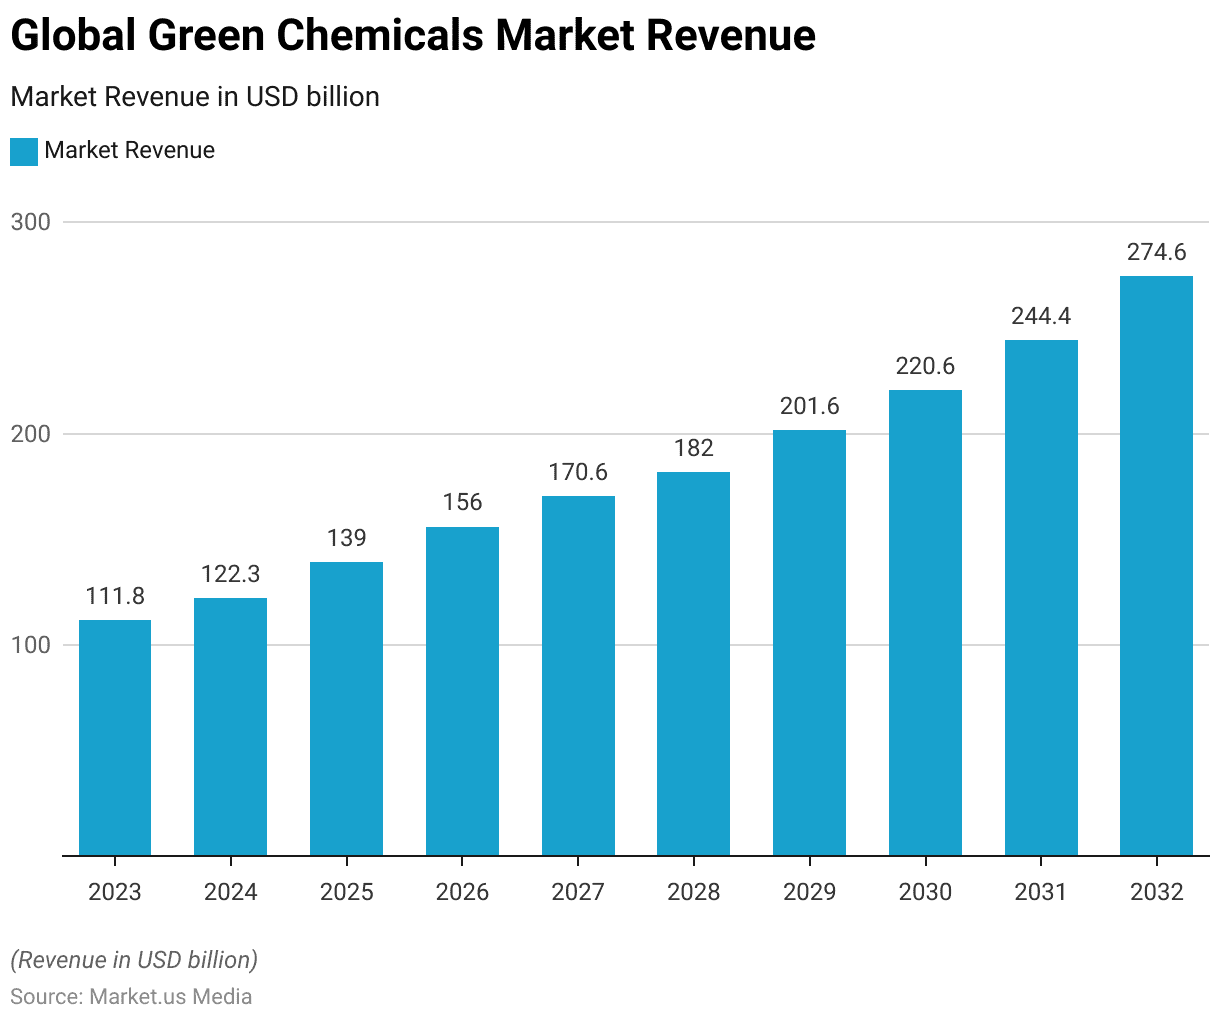
- The global green chemicals market has been experiencing steady growth in revenue over the past decade at a CAGR of 10.8%.
- Starting at USD 100.9 billion in 2022, the market saw an increase to USD 111.8 billion in 2023 and further growth to USD 122.3 billion in 2024.
- The upward trend continues with projected revenues of USD 139.0 billion in 2025 and USD 156.0 billion in 2026.
- By 2027, the market is anticipated to reach USD 170.6 billion, followed by USD 182.0 billion in 2028.
- The momentum persists with expected revenues of USD 201.6 billion in 2029, surpassing the USD 220.6 billion mark in 2030.
- The growth trajectory remains robust, with projections indicating revenues of USD 244.4 billion in 2031 and USD 274.6 billion in 2032.
- This consistent growth reflects the increasing demand for sustainable solutions across various industries, driving the global green chemicals market expansion.
(Source: Market.us)

Global Green Chemicals Solvents Market Size Statistics
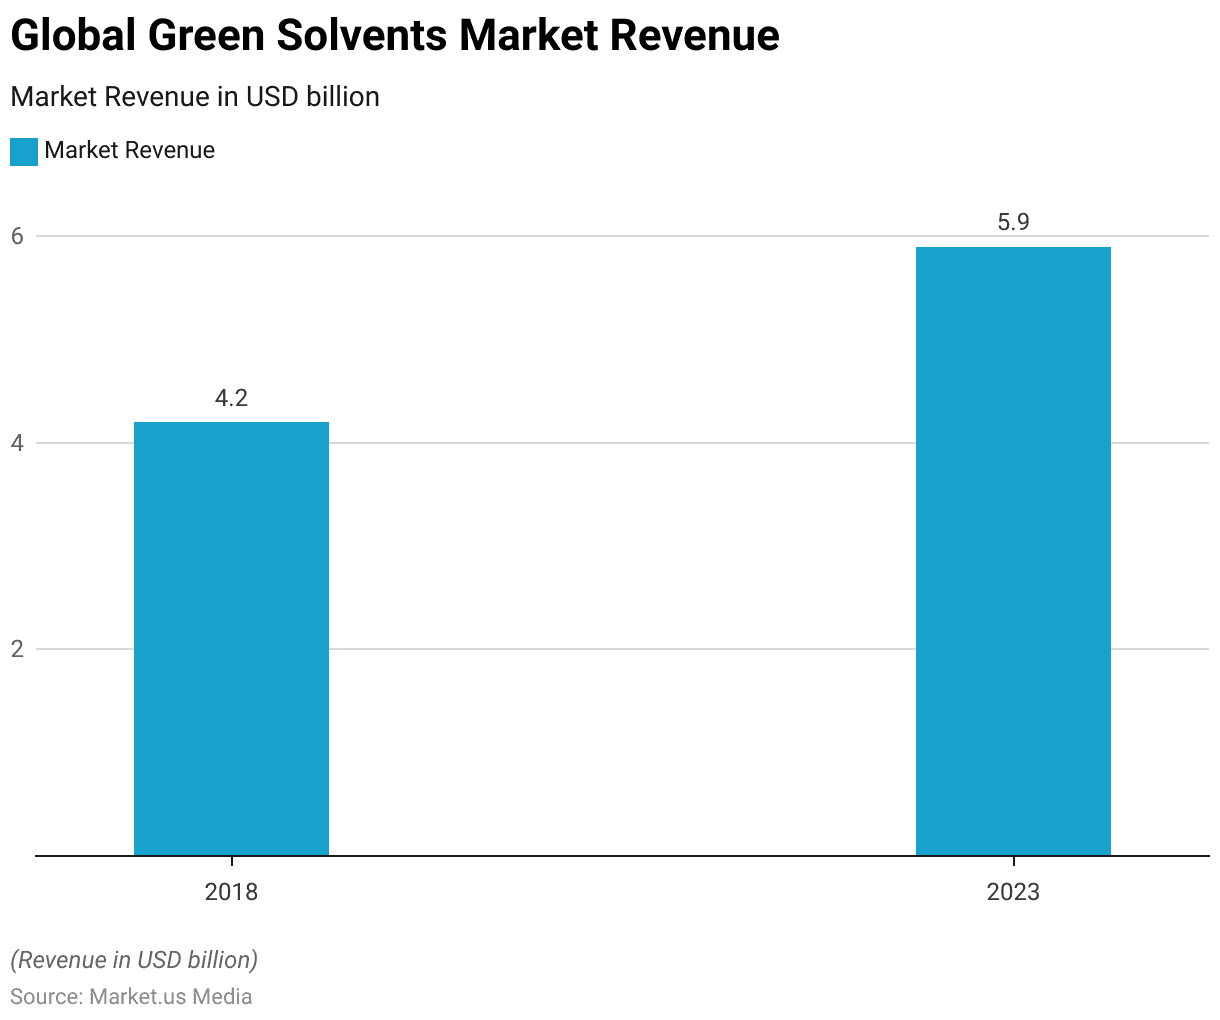
- The global green solvents market has witnessed notable growth in revenue between 2018 and 2023.
- Beginning at USD 4.2 billion in 2018, the market experienced a steady increase, reaching USD 5.9 billion by 2023.
- This growth trajectory reflects the rising demand for environmentally friendly solvents across various industries.
- Increasing awareness of environmental issues, stringent regulations on traditional solvents, and shifting towards sustainable practices have expanded the green solvents market.
- As industries prioritize sustainability and seek alternatives to conventional solvents. The global green solvents market is expected to continue its upward trajectory in the coming years.
(Source: Statista)

Bioplastics Statistics
Global Production of Bioplastics
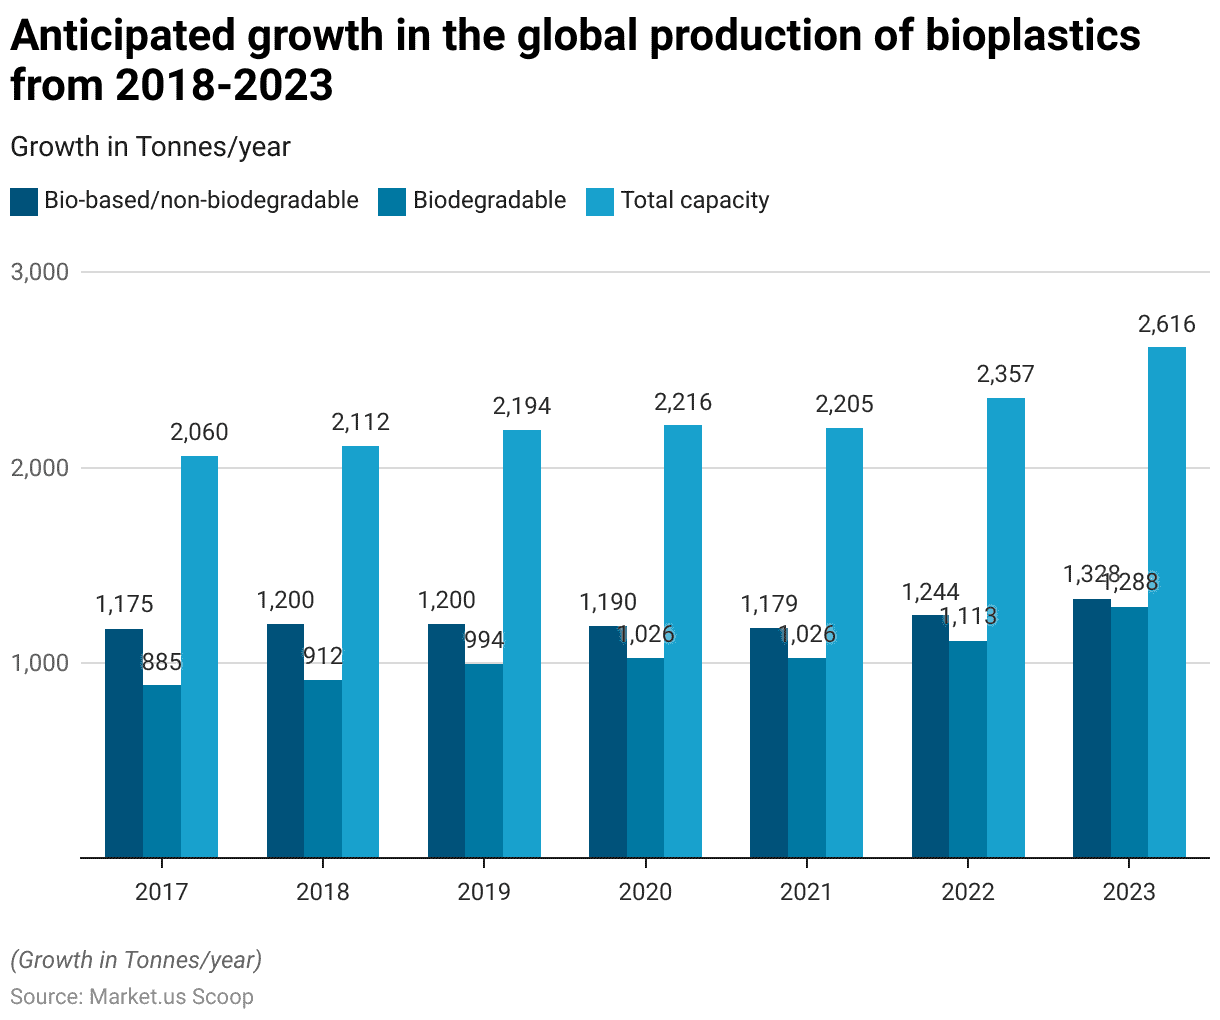
- Between 2018 and 2023, the global production of bioplastics is expected to demonstrate substantial growth across bio-based, non-biodegradable, and biodegradable categories.
- In 2018, the total capacity stood at 2112 tonnes/year, with 1200 tonnes/year of bio-based non-biodegradable and 912 tonnes/year of biodegradable bioplastics.
- This trend continued as the total capacity increased to 2616 tonnes/year by 2023.
- Notably, the production of bio-based non-biodegradable bioplastics rose from 1200 tonnes/year in 2018 to 1328 tonnes/year in 2023, indicating a consistent upward trajectory.
- Similarly, biodegradable bioplastics witnessed significant growth, reaching 1288 tonnes/year in 2023 from 912 tonnes/year in 2018.
- This anticipated growth underscores the increasing adoption of bioplastics as sustainable alternatives to traditional plastics. Driven by environmental concerns and regulatory initiatives promoting eco-friendly practices in the plastics industry.
(Source: European Bioplastics, Nova-Institute)
Global Production Capacities of Bioplastics – By Material Type
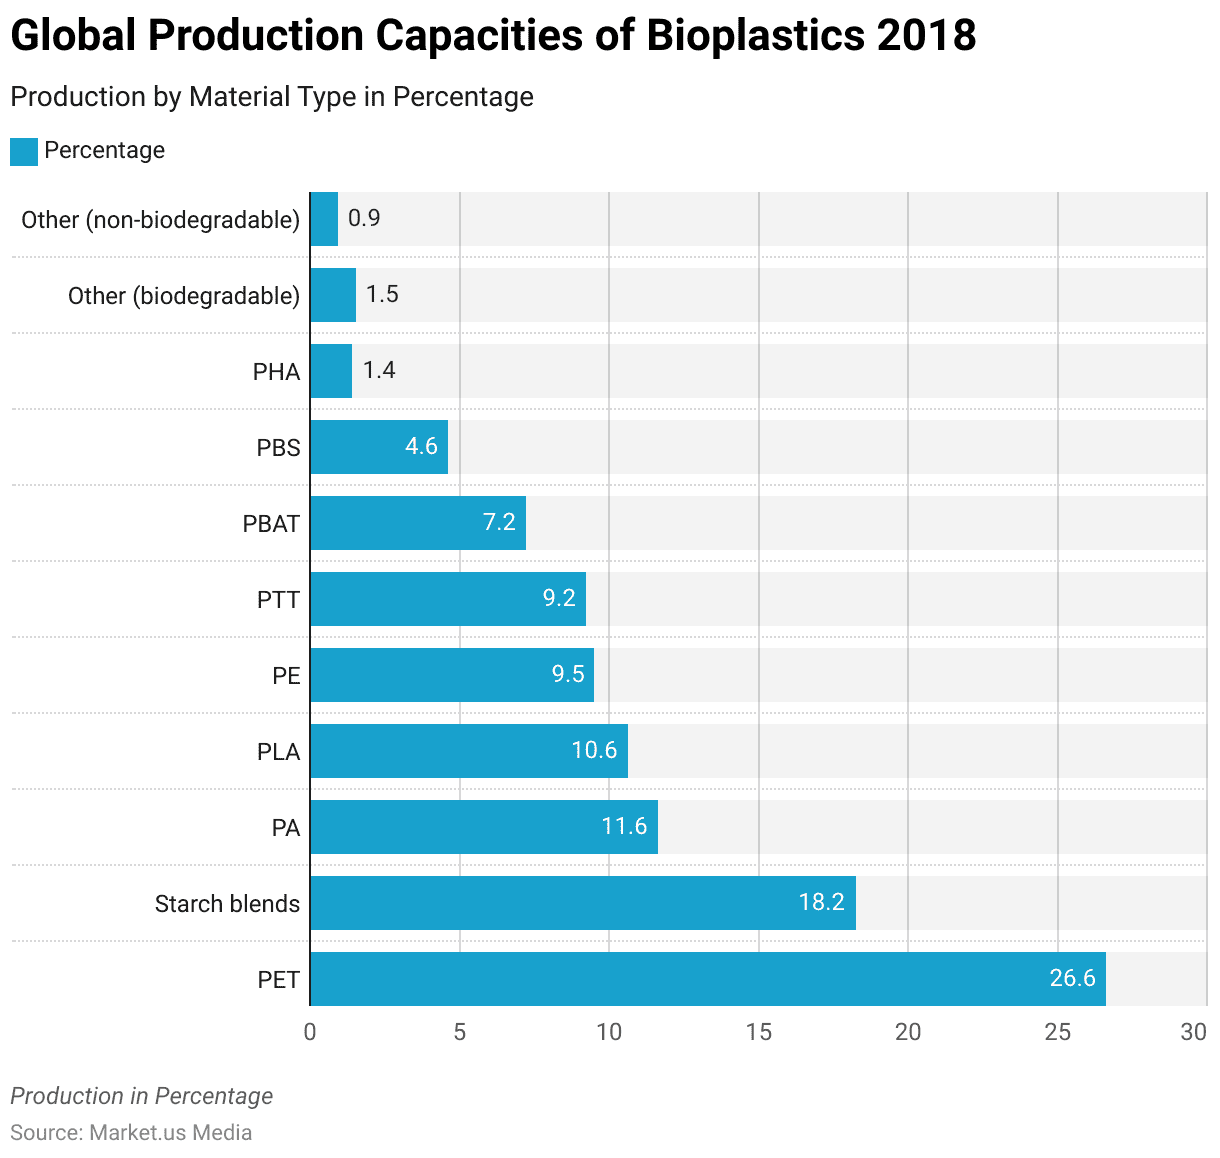
- In 2018, the global production capacities of bioplastics varied across different material types.
- PET constituted the largest share at 26.6%, followed by starch blends at 18.2%.
- Polyamide (PA) accounted for 11.6% of the production capacities, while Polylactic Acid (PLA) and Polyethylene (PE) contributed 10.6% and 9.5%, respectively.
- Other notable contributors included Polytrimethylene Terephthalate (PTT) at 9.2% and Polybutylene Adipate Terephthalate (PBAT) at 7.2%. Polybutylene Succinate (PBS) and Polyhydroxyalkanoates (PHA) represented smaller shares at 4.6% and 1.4%, respectively.
- The remaining production capacity was distributed among biodegradable (1.5%) and non-biodegradable (0.9%) materials.
- These figures depict the diverse landscape of bioplastic production, highlighting the prominence of PET and starch blends while showcasing the growing utilization of alternative materials such as PLA and PBAT in the global market.
(Source: European Bioplastics, Nova-Institute)
Global Bioplastics Production Capacities – by Region
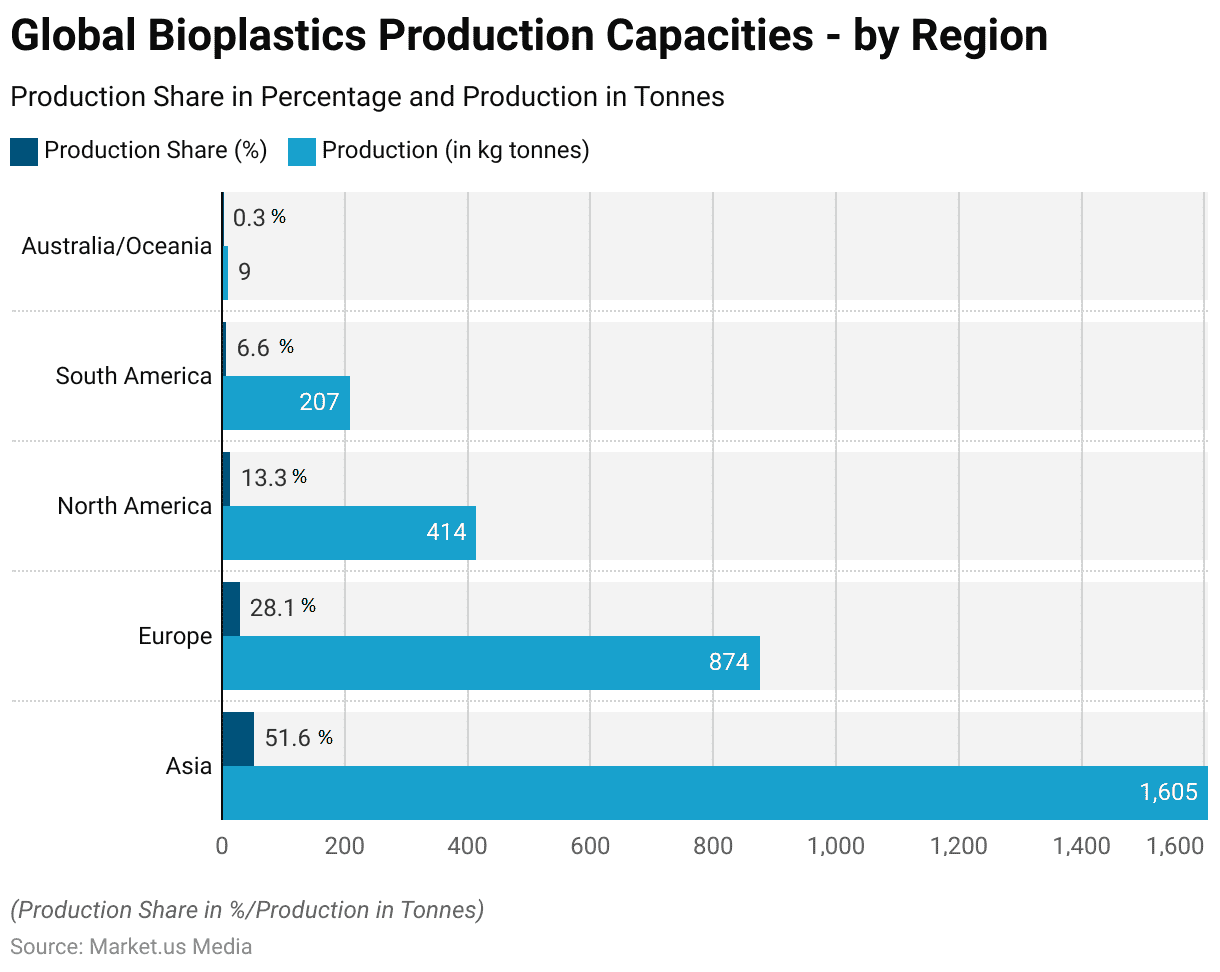
- In 2024, bioplastics production capacities varied across regions, reflecting a dynamic global landscape.
- Asia emerged as the dominant player, contributing 51.6% of the total production, equivalent to 1605 kg tonnes.
- Following closely, Europe accounted for 28.1% of production, representing 874 kg tonnes.
- North America and South America trailed behind, with production shares of 13.3% and 6.6%, respectively, translating to 414 kg tonnes and 207 kg tonnes.
- Australia/Oceania contributed minimally, holding just 0.3% of the production share, amounting to 9 kg tonnes.
- These regional disparities underscore the diverse geographical distribution of bioplastic manufacturing, with Asia and Europe leading the charge. At the same time, other regions play a comparatively more minor role in the global market.
(Source: Biopolymers, Facts and Statistics)
Green Chemicals By Bio-polymer Statistics
Bio-polymer Production
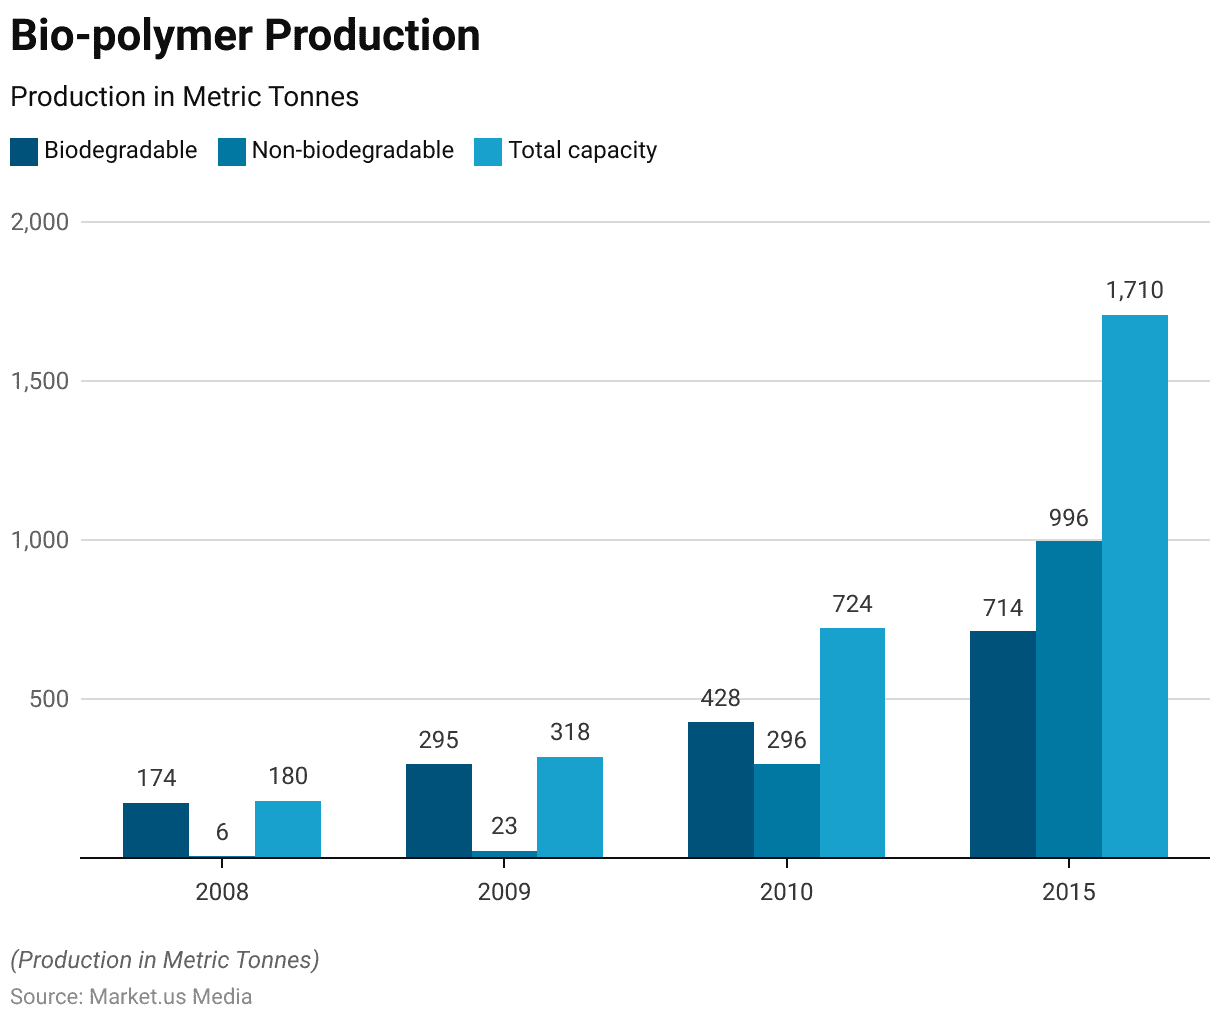
- Between 2008 and 2015, bio-polymer production capacities exhibited significant growth, reflecting increasing demand and technological advancements in bioplastics.
- In 2008, the total capacity stood at 180 metric tonnes, with 174 metric tonnes allocated to biodegradable (including not bio-based) and a mere six metric tonnes to non-biodegradable (bio-based) materials.
- Over the subsequent years, there was a notable expansion, with total capacities reaching 318 metric tonnes in 2009 and 724 metric tonnes in 2010.
- By 2015, the total capacity had surged to 1710 metric tonnes, showcasing a remarkable increase.
- During this period, the production capacities of both biodegradable and non-biodegradable bio-polymers experienced substantial growth. With biodegradable capacities reaching 714 metric tonnes and non-biodegradable capacities totaling 996 metric tonnes.
- This upward trajectory underscores the growing adoption of bioplastics as sustainable alternatives to traditional polymers. They are driven by environmental concerns and regulatory incentives promoting using renewable resources in manufacturing processes.
(Source: Science Direct)
Consumption of Biodegradable Polymers – By End Use
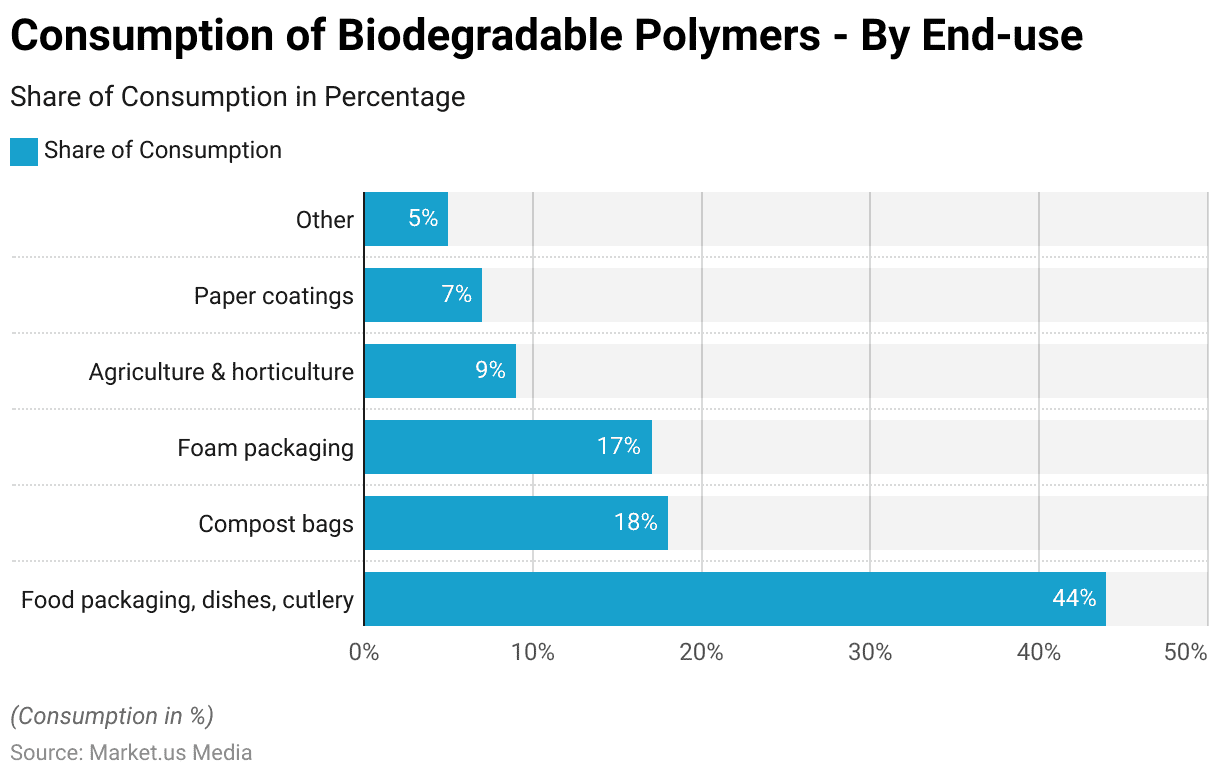
- In 2015, the worldwide consumption of biodegradable polymers exhibited a diverse distribution across various end uses.
- The predominant segment was food packaging, dishes, and cutlery, comprising 44% of the total consumption, indicating a significant reliance on biodegradable materials in the food packaging industry.
- Compost bags followed closely, representing 18% of the consumption share, emphasizing the growing adoption of environmentally friendly alternatives in waste management practices.
- Foam packaging accounted for 17% of consumption, reflecting its usage in diverse packaging applications.
- Agriculture and horticulture constituted 9% of consumption, indicating a notable utilization in these sectors for applications such as mulching films and plant pots.
- Paper coatings represented 7% of consumption, suggesting a niche yet noteworthy presence in enhancing the sustainability of paper products.
- The remaining 5% was attributed to various other applications, highlighting the versatility of biodegradable polymers across multiple industries.
- This distribution underscores the widespread acceptance and integration of biodegradable materials into various sectors, driven by environmental concerns and regulatory pressures.
(Source: Statista)
Adoption of Green Chemicals Marketed Products Statistics
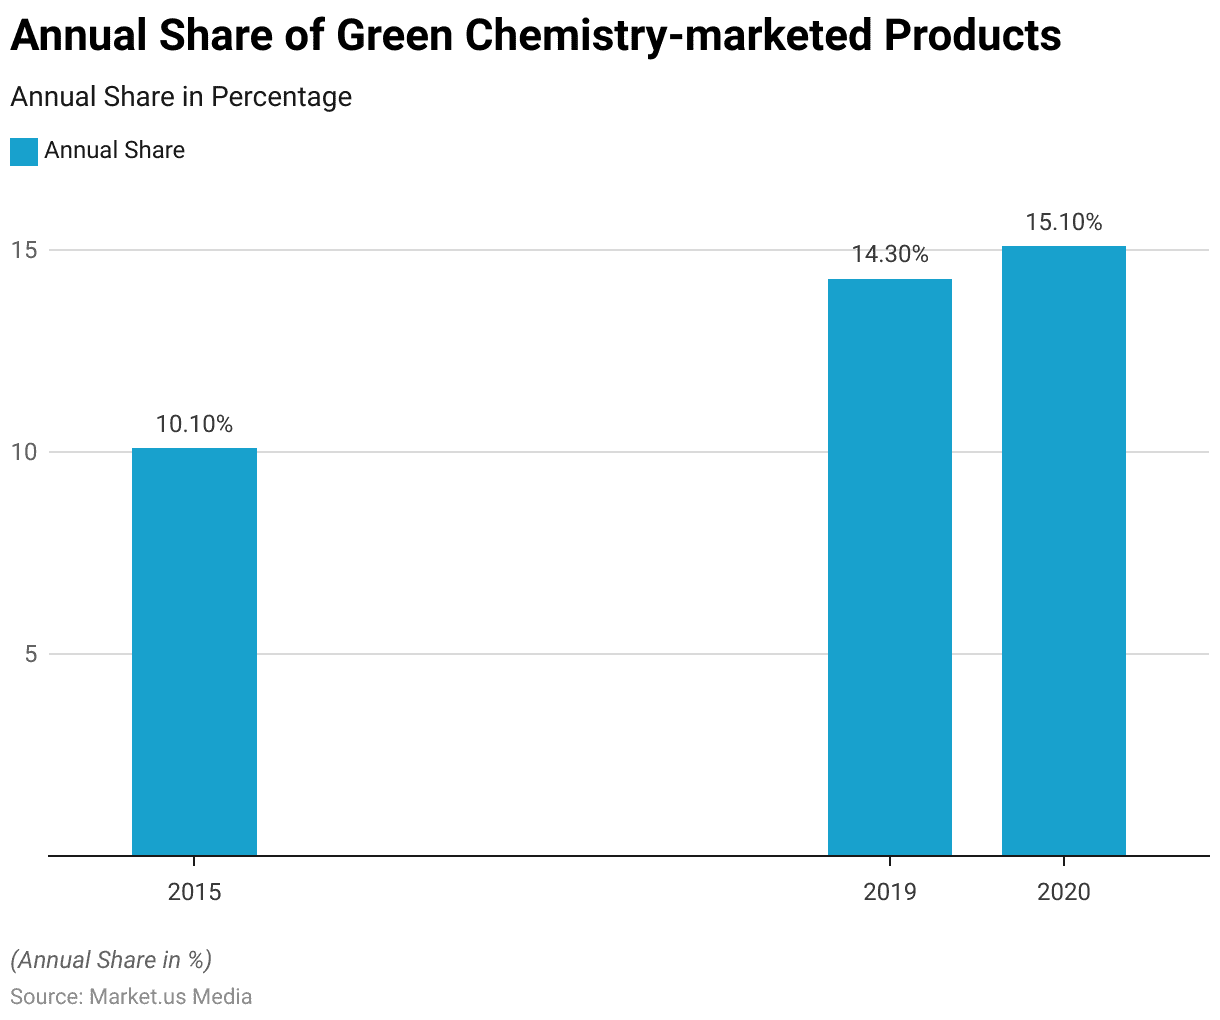
- The annual share of green chemistry-marketed products has steadily increased over the years.
- In 2015, it stood at 10.10%, indicating a notable presence of environmentally friendly products.
- By 2019, this share had risen to 14.30%, reflecting a growing trend towards sustainability and eco-conscious consumer choices.
- In 2020, the share continued to climb, reaching 15.10%, underscoring the expanding demand and adoption of green chemistry solutions across various industries.
- This upward trajectory suggests a promising shift towards more sustainable and environmentally responsible product development and consumption practices.
(Source: New York University)

Top Priority Policy Recommendations for Green Chemicals Statistics
- Based on their perceived medium to very high impact, the ranking of top-priority policy recommendations reveals several critical initiatives for advancing green and sustainable chemistry.
- The phase-out or restriction of chemical substances is the most common, cited by 95% of respondents.
- Following closely are federal and state tax policies incentivizing green and sustainable products, with 87.13% ranking this as highly impactful.
- Additionally, there is significant support for expediting new chemical review processes for green chemistry and establishing specific federal purchasing specifications for such products.
- Increasing federal funding for research and development in green chemistry and sustainable products is also viewed favorably by 80% of respondents.
- Federal executive orders promoting government purchasing of green chemistry projects enhanced federal recognition programs, and streamlining permitting for green chemistry facilities are among the other priority recommendations.
- Further initiatives include favorable loan lending rates and guarantees, U.S. patent extensions, and the development of industrial codes covering green chemistry and sustainable products, albeit with slightly lower levels of support.
(Source: New York University)
Biorefinery Platforms for Chemicals Production
CO2‐Platform
- The latest IPCC report highlights the necessity of achieving net CO2 sequestration to limit global temperature rise below 1.5°C.
- Bio-based chemicals and materials, particularly those derived from fermentation processes using biogenic CO2, offer a promising solution. However, this requires increased collaboration across sectors and exploration of industrial symbiosis opportunities.
- The conversion of CO2 into intermediates is already being addressed in research projects like Carbon4PUR.
- Methanol, a key chemical globally, is traditionally produced from synthesis gas. A low-carbon alternative involves making hydrogen from water electrolysis using low-carbon electricity, followed by hydrogenation of CO2.
- 2011 Carbon Recycling International (CRI) launched the “George Olah Renewable Methanol Plant” to highlight Iceland’s geothermal energy potential. Initially designed for 1,300 metric tons capacity, the 7.1 million euro plant now produces 4,000 tons of renewable methanol annually.
- Acting as a pilot, it sets the stage for a planned 40,000-ton extension. CO2 from geothermal plants and hydrogen from 5 MW water electrolysis, powered by geothermal energy, are continuously utilized.
- The methanol, blended into gasoline, substitutes 2.5% of Iceland’s fuel consumption and aids biodiesel production. Compared to fossil-fuel methanol, renewable methanol reduces greenhouse gas emissions by 90%. Additionally, plans for a second plant in China have been announced.
(Source: IEA Bioenergy)
Syngas Platform
- Synthesis gas (syngas) is a gas mixture comprising carbon monoxide (CO), hydrogen (H2), methane (CH4), carbon dioxide (CO2), and nitrogen (N2).
- It is produced through biomass gasification at high temperatures, typically between 800-1500˚C, in the presence of oxygen or air.
- Historically, gasification technology has primarily focused on energy generation, with many gasifiers used for power production. However, after purification, syngas can undergo thermochemical catalysis to yield alcohols like methanol and ethanol, fuels such as Fischer-Tropsch diesel, and various chemical products.
- The Fischer-Tropsch process, which produces hydrocarbons, is widely used on an industrial scale. There is also growing interest in utilizing syngas as a substrate for microbial fermentation to produce alcohols like ethanol and butanol and other chemical building blocks like acetic acid.
(Source: IEA Bioenergy)
Green Chemical Transformation Products from Sugars Statistics
- Sugars are crucial intermediates in chemically catalyzed processes, undergoing various reactions to produce valuable products such as sorbitol, furfural, glucaric acid, hydroxymethylfurfural, and levulinic acid.
- For example, sorbitol and xylitol are widely produced sugar alcohols, with sorbitol’s demand projected to exceed 2 million tonnes in 2018. Sorbitol serves as a food ingredient and precursor for bio-based plastics like isosorbide.
- Another illustration is furfural production from cellulose or hemicellulose in biomass, where high temperatures and mineral acids drive hemicellulose hydrolysis followed by xylose dehydration.
- This process operates at an industrial scale, with annual production volumes surpassing 360,000 tonnes.
- Additionally, there’s a growing interest in developing new catalytic processes to convert sugars into chemical building blocks like mono-ethylene glycol and methyl vinyl glycolate, which are crucial for plastic manufacturing.
(Source: IEA Bioenergy)
Critical Initiatives for Green Chemicals Infrastructure Statistics
Inflation Reduction Act (IRA)
- President Biden signed the Inflation Reduction Act (IRA) into law in August 2022, primarily targeting inflation. However, it has also transformed the landscape for green investment in the US, prompting a competitive pursuit of opportunities.
- Hydrogen production processes emitting less than 0.45 kilograms of CO2e per kilogram of hydrogen receive the full base credit. Those emitting between 0.45 to 1.5 kilograms of CO2e receive one-third of this credit.
- Additionally, the Act expands Section 45Q tax credits for CCUS, assisting emission reduction efforts across industries.
- However, credit amounts vary based on the technology. Standard credits can reach up to $85 per tonne of CO2 permanently stored and $60 per tonne for CO2 used in EOR.
- For DAC, credits increase to $180 per tonne of CO2 permanently stored and $130 per tonne for used CO2. Provisions supporting local economies and workers will also significantly impact project tax credits.
(Source: KPMG)
Green Deal Industrial Plan (GDIP)
- On February 1, 2023, the European Commission unveiled its Green Deal Industrial Plan (GDIP) to navigate the net-zero era. The GDIP aims to facilitate access to tax incentives for sustainable companies, channel funds into clean-tech sectors, and relax state aid regulations.
- The GDIP includes the proposed Net Zero Industry Act (NZIA), which focuses on emission reduction through cleaner technologies and processes like renewable energy and energy efficiency.
- It advocates for green public procurement, increases green tech research and development, and incentivizes green investments. The NZIA also aims to foster a circular economy by promoting material reuse, recycling, and developing eco-friendly products and services.
- To ensure an equitable transition to a net-zero economy, the Act provides financial and technical support to those affected, including worker retraining, upskilling, and financial assistance for businesses investing in green technologies.
(Source: KPMG)
US Superfund Excise Tax
- Comparing regulatory models across jurisdictions presents challenges, but chemical companies must consider each region’s tax and legal frameworks as critical factors for global investment strategies.
- While the Inflation Reduction Act (IRA) primarily offers incentives, other legislation, like the reinstated Superfund Excise Tax, is a regulatory stick. This tax, relevant to industries including chemicals, gas, and petroleum, applies to many taxable chemicals and hazardous substances.
- Unlike the previous version, the threshold for taxation now stands at 20% of listed chemicals in a substance.
- Compliance may pose more of an administrative burden than a financial one, requiring companies to analyze product compositions and supply chains to identify taxable chemicals.
(Source: KPMG)
Recent Developments
Investments in Technology and Resources:
- Companies in the green chemicals sector are heavily investing in new technologies and improving resource procurement to enhance their product portfolios and adapt to market demands.
- These strategies are crucial for sustaining growth and overcoming the challenges posed by a competitive and rapidly evolving market.
Government Support and Market Growth:
- Government policies and incentives aimed at promoting sustainable practices have significantly bolstered the growth of the manufacturing sector for bio-chemicals and other green materials.
- This support is pivotal in helping the industry navigate economic fluctuations and the uneven recovery across various end markets.
Mergers and Acquisitions Trends:
- While the overall M&A activity in the green chemicals market has seen moderation in 2023, a resurgence is expected in early 2024.
- Strategic acquisitions are being pursued to bolster margin strength and expand geographic presence, with 62.5% of deals involving well-capitalized strategic buyers and private strategics accounting for 40.6% of engagements.
Product Innovation and Market Adaptation:
- Continuous product innovation is a key trend, with companies actively expanding their green chemicals portfolios to meet the increasing demand for sustainable products.
- These innovations often focus on cleaner production processes and more sustainable raw material inputs.
Regional Market Dynamics:
- The green chemicals market is experiencing varied dynamics across different regions. For instance, North America and Europe are leading in adopting green chemical technologies due to strong regulatory frameworks and consumer awareness towards sustainability.
- Meanwhile, markets in Asia Pacific are rapidly growing due to increasing industrial activities and investments in green technologies.
Conclusion
Green Chemicals Statistics – In conclusion, the green chemicals industry is witnessing significant growth, propelled by the pressing necessity to tackle environmental issues and advance sustainability efforts.
Regulatory requirements power this surge, shifting consumer demands and corporate commitments to sustainability.
As green chemicals gain traction, they are becoming essential in multiple sectors, providing environmentally friendly options and aiding in achieving global environmental objectives.
Driving factors behind this expansion encompass technological advancements, favorable governmental regulations, and increasing consumer consciousness.
Collaboration and innovative approaches will be pivotal in expediting the adoption of green chemicals, ensuring a sustainable trajectory for the future.
FAQs
Green chemicals, or sustainable chemicals, are substances manufactured using methods that minimize environmental harm and promote sustainability. These chemicals originate from renewable sources, break down naturally, and pose minimal risks to human health and ecosystems.
Green chemicals are produced through various processes that prioritize sustainability. These methods often involve using renewable feedstocks, employing eco-friendly manufacturing processes, and minimizing waste and emissions.
The benefits of using green chemicals are manifold. They include reducing environmental pollution, minimizing reliance on fossil fuels, conserving natural resources, enhancing human health and safety, and meeting regulatory requirements for sustainability.
Green chemicals find applications across diverse industries, including manufacturing, agriculture, consumer goods, pharmaceuticals, and personal care products. They can be used as ingredients, additives, or raw materials in various processes and products.
Green chemicals contribute to sustainability by reducing the environmental impact of industrial processes and products. They help mitigate climate change, conserve natural resources, and promote the transition towards a circular economy by minimizing waste and pollution.
Discuss your needs with our analyst
Please share your requirements with more details so our analyst can check if they can solve your problem(s)