


Introduction
According to Ethanol Statistics, Ethanol, or ethyl alcohol (C2H5OH). It is a versatile chemical compound utilized primarily as a biofuel additive in gasoline and as a key ingredient in alcoholic beverages.
It is typically produced through the fermentation of sugars from various feedstocks such as corn, sugarcane, and cellulose-based materials.
Ethanol serves as a renewable energy source, with lower overall carbon emissions compared to fossil fuels. However, challenges include feedstock availability, land use concerns, and energy balance considerations.
Despite these challenges, ethanol plays a significant role in reducing greenhouse gas emissions and promoting renewable energy adoption. Supported by regulatory frameworks mandating its use in fuel blends and incentivizing production.
Editor’s Choice
- The global ethanol market revenue reached 108.0 billion in 2023.
- North America leads the market with a substantial share of 40.0%. Owing to its well-established ethanol production infrastructure and supportive regulatory environment.
- Among companies, AB Miller and Archer Daniels Midland Company hold significant shares, each commanding 14% of the market.
- Ethanol is commonly used in various industries and is subject to exposure limits, with a TLV-TWA of 1900 mg/m3.
- The United States stood at the forefront with a production volume of 15,550 million gallons.
- In March 2024, in North America, the price was recorded at US$0.59 per kilogram. Marking a 1.7% increase from the previous period.
- Ethanol production, distribution, and blending are regulated by the Environmental Protection Agency (EPA) under the Renewable Fuel Standard (RFS) program.
Global Ethanol Market Overview
Global Ethanol Market Size
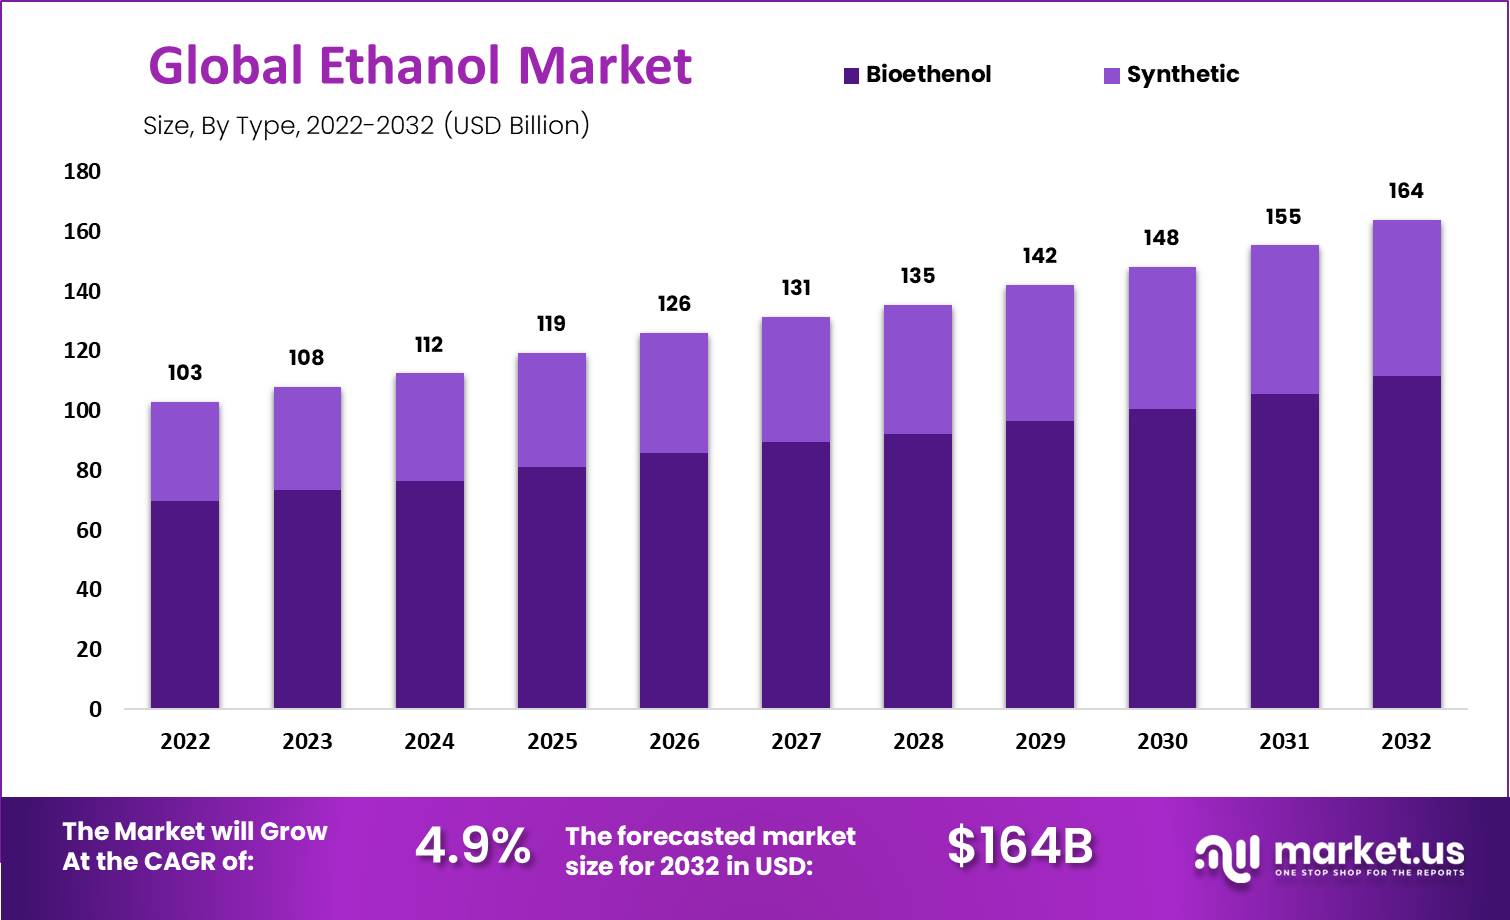
- The global ethanol market has witnessed steady growth in revenue over the past decade at a CAGR of 4.9%, with a consistent upward trend projected into the foreseeable future.
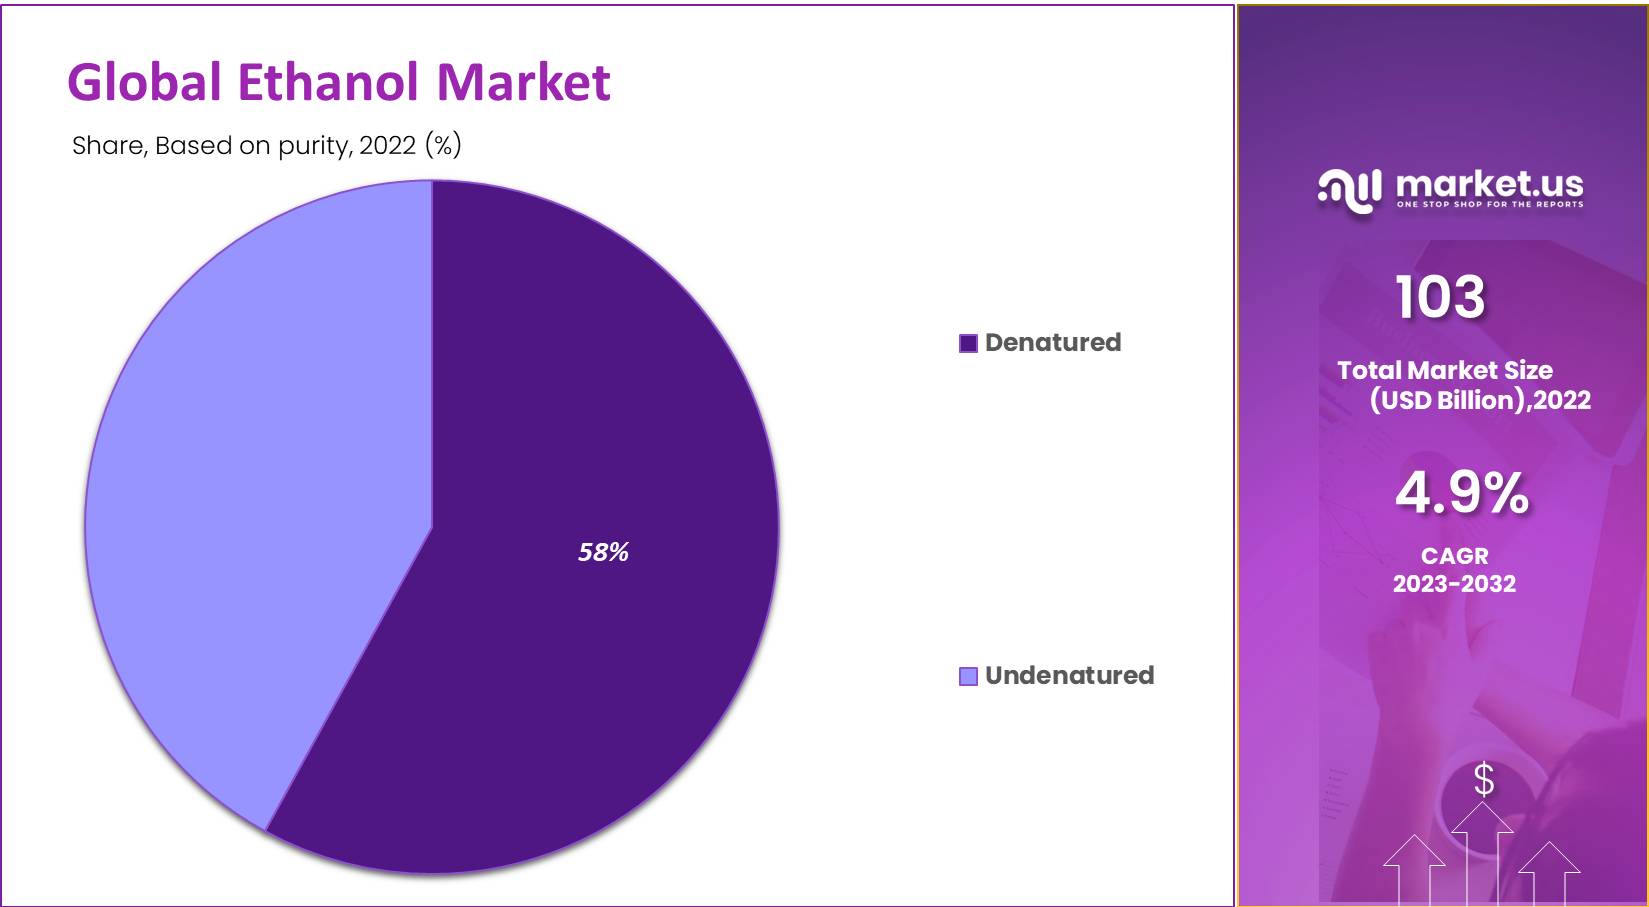
- In 2022, the market revenue stood at USD 103.0 billion, climbing to USD 108.0 billion in 2023.
- This positive trajectory continued with revenues reaching USD 112.0 billion in 2024 and further increasing to USD 119.0 billion in 2025.
- By 2030, the market is anticipated to surpass USD 148.0 billion. With continued growth reaching USD 155.0 billion in 2031 and USD 164.0 billion in 2032.

Regional Analysis of the Global Ethanol Market
- The global ethanol market is distributed among several key regions, each contributing to its overall composition.
- North America leads the market with a substantial share of 40.0%. Owing to its well-established production infrastructure and supportive regulatory environment.
- Following closely behind is the Asia-Pacific (APAC) region, holding 21.0% of the market share. Driven by increasing demand for biofuels amid growing energy needs and environmental concerns.
- Europe accounts for 16.0% of the market, emphasizing its commitment to reducing carbon emissions through renewable energy sources.
- Latin America holds a significant share of 19.0%, largely attributed to production from sugarcane.
- Lastly, the Middle East & Africa (MEA) region contributes 4.0% to the global market. Indicating a growing interest in renewable energy alternatives despite its comparatively smaller share.
Competitive Landscape of Global Ethanol Market
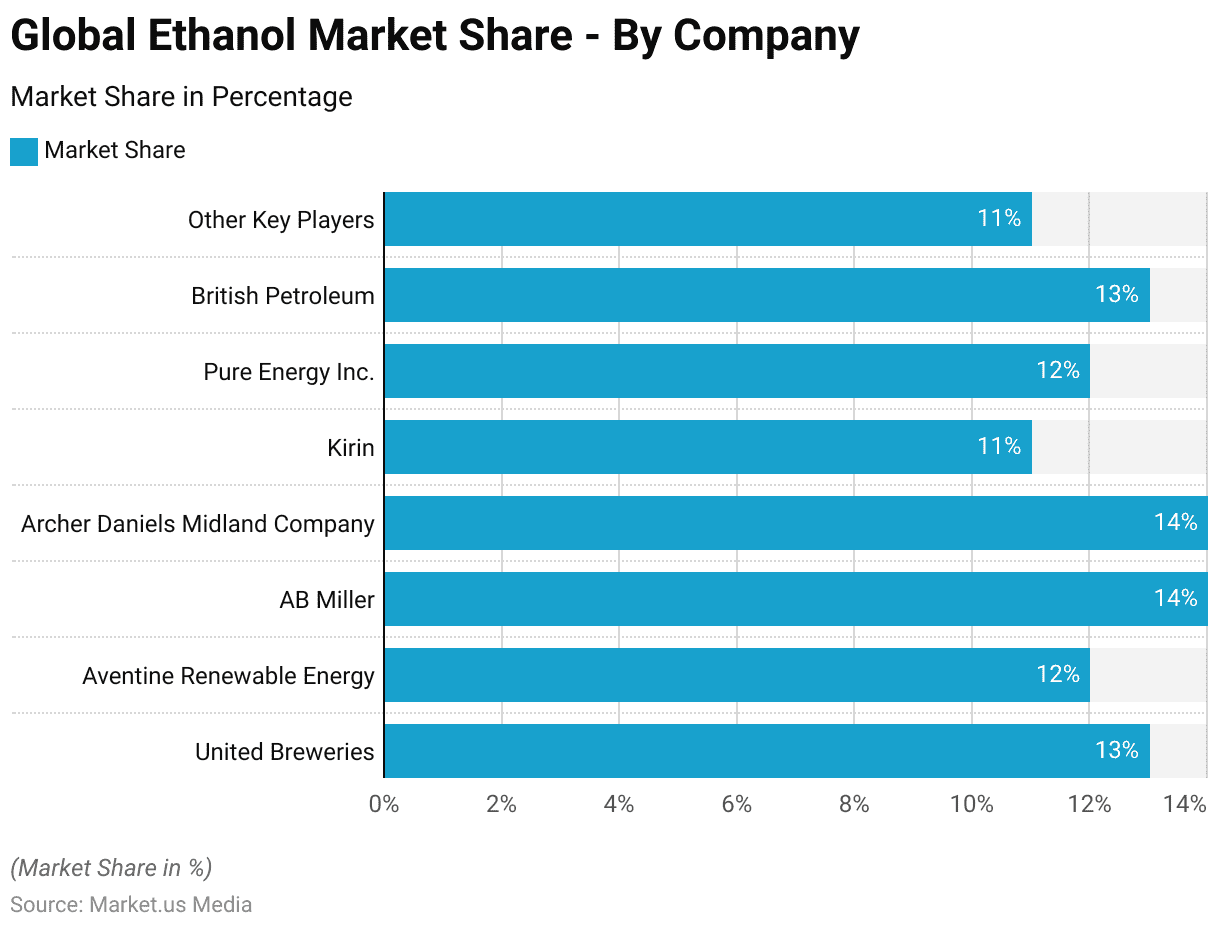
- A diverse landscape of key players characterizes the ethanol market. Each vying for market share and contributing to the industry’s overall dynamics.
- Among these, AB Miller and Archer Daniels Midland Company hold significant shares, each commanding 14% of the market.
- United Breweries, Pure Energy Inc., and British Petroleum closely follow, each securing a 13% share.
- Aventine Renewable Energy and other key players each claim 12% of the market, demonstrating their substantial presence in the industry.
- Kirin, with an 11% share, adds to the competitive mix, reflecting the global reach of producers.

Chemical Properties of Ethanol
- Ethanol, also known as ethyl alcohol, exhibits various physical and chemical properties. It is a colorless liquid with a pleasant alcoholic odor, melting at -114°C and boiling at 78°C.
- Ethanol has a density of 0.789 g/mL at 20°C and is completely soluble in water. It has a flash point of 12°C and is stable at room temperature.
- Ethanol is hygroscopic and forms explosive mixtures with air. The odor threshold for ethanol is 0.52 ppm, and it has a refractive index of 1.3614.
- It is miscible with water and has a dielectric constant of 24.3 at 25°C.
- Ethanol is commonly used in various industries and is subject to exposure limits, with a TLV-TWA of 1900 mg/m3.
Fuel Ethanol Statistics
Ethanol Fuel Consumption
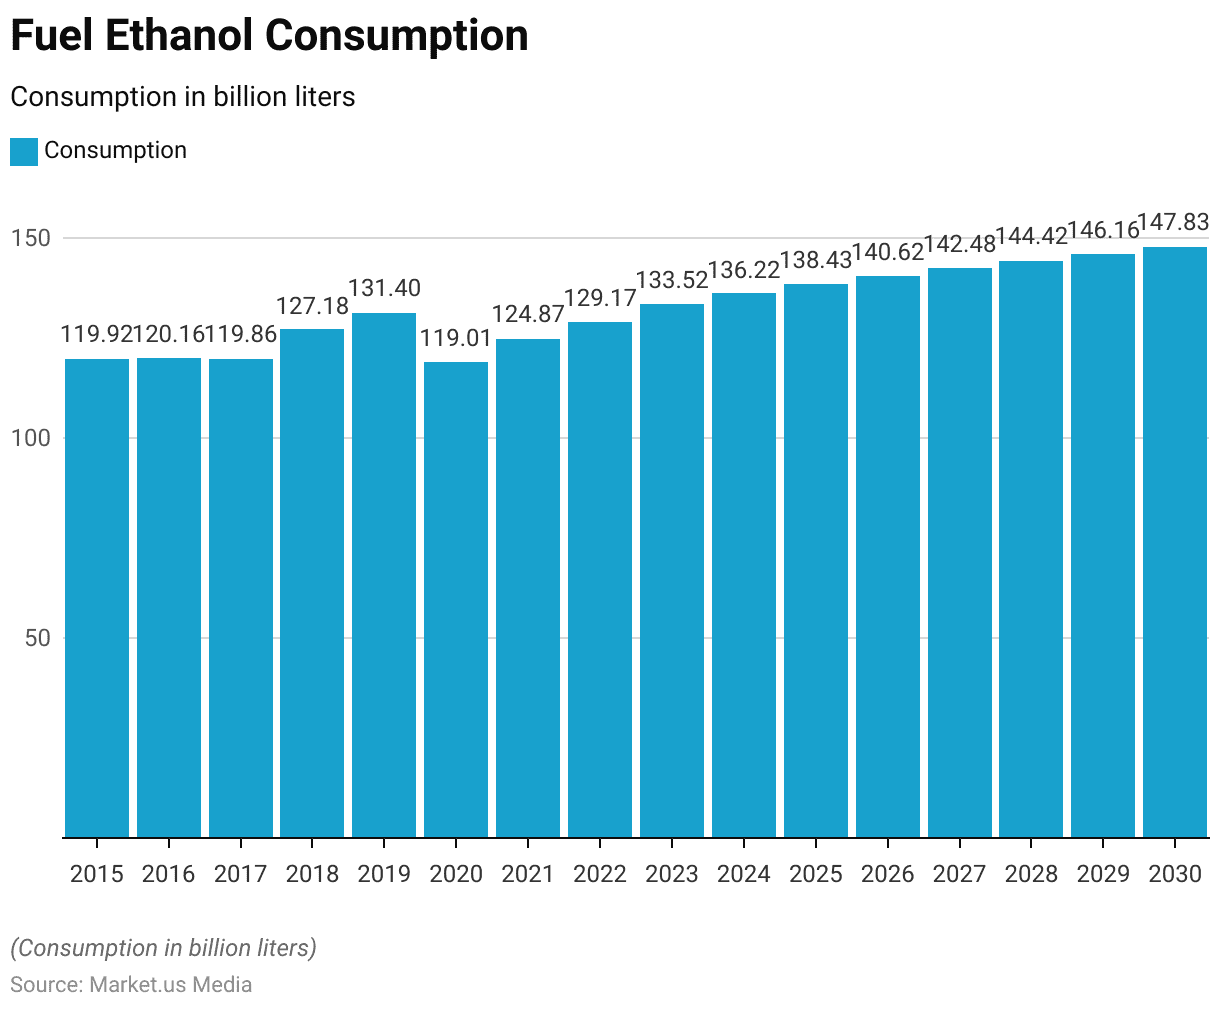
- Fuel ethanol consumption has shown fluctuating trends over the past decade, with varying levels of demand observed annually.
- In 2015, consumption stood at 119.92 billion liters, experiencing minor fluctuations in the following years.
- However, a notable increase was recorded in 2018, with consumption rising to 127.18 billion liters, followed by further growth to 131.4 billion liters in 2019.
- Despite this upward trajectory, consumption declined in 2020 to 119.01 billion liters, possibly influenced by global events or market dynamics.
- However, a rebound occurred in 2021, with consumption reaching 124.87 billion liters.
- Subsequent years saw steady growth, with consumption expected to rise to 147.83 billion liters by 2030.

Fuel Ethanol Production – By Country
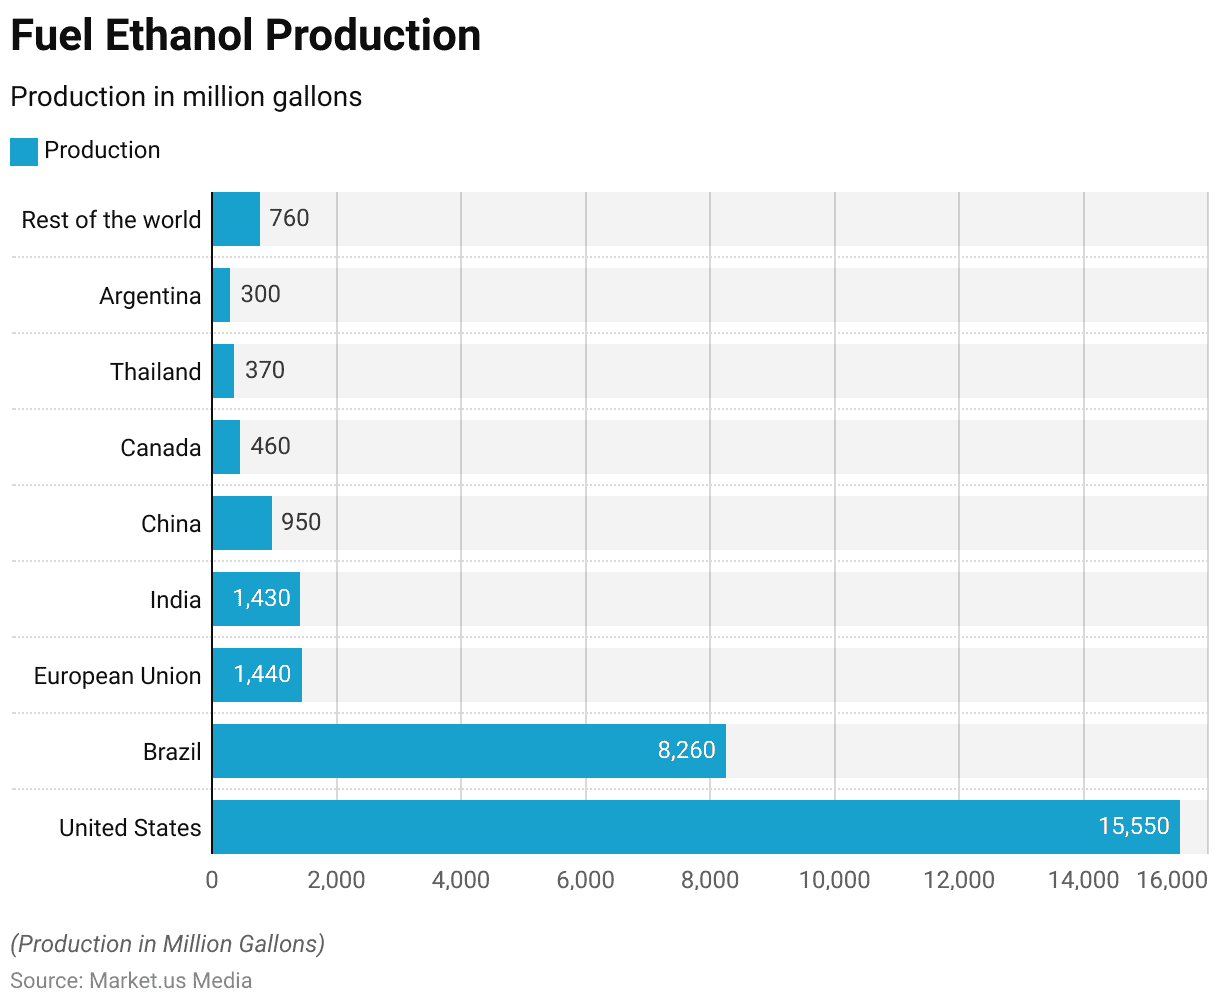
- In 2023, fuel ethanol production was led by several prominent countries, each contributing significantly to the global output.
- The United States stood at the forefront with a production volume of 15,550 million gallons, followed closely by Brazil with 8,260 million gallons.
- The European Union, India, and China also made substantial contributions. Producing 1,440 million gallons, 1,430 million gallons, and 950 million gallons, respectively.
- Canada, Thailand, and Argentina followed suit with production volumes of 460 million gallons, 370 million gallons, and 300 million gallons, respectively.
Global Ethanol Export Statistics
- In 2023, the United States maintained its position as the leading global supplier and exporter of ethanol. Producing 15.6 billion gallons, which accounted for 53% of the world’s output—nearly double that of Brazil and ten times the European Union’s production.
- National commitments to reducing greenhouse gas emissions and improving air quality, alongside post-pandemic travel demand recovery, created significant opportunities for the U.S. on a global scale.
- Exports reached a record 1.43 billion gallons, valued at $3.82 billion, equivalent to 9% of domestic production and the third-highest export volume ever.
- Approximately 73% of global demand was for denatured. The majority of U.S. exports, three-fourths, were destined for Canada, the United Kingdom, and the European Union, with the rest distributed across 80 countries.
- However, a 16% tariff-rate quota led to a decline in the Brazilian market, and U.S. ethanol exports remained restricted from entering China due to prohibitive tariffs.
Global Ethanol Import Statistics
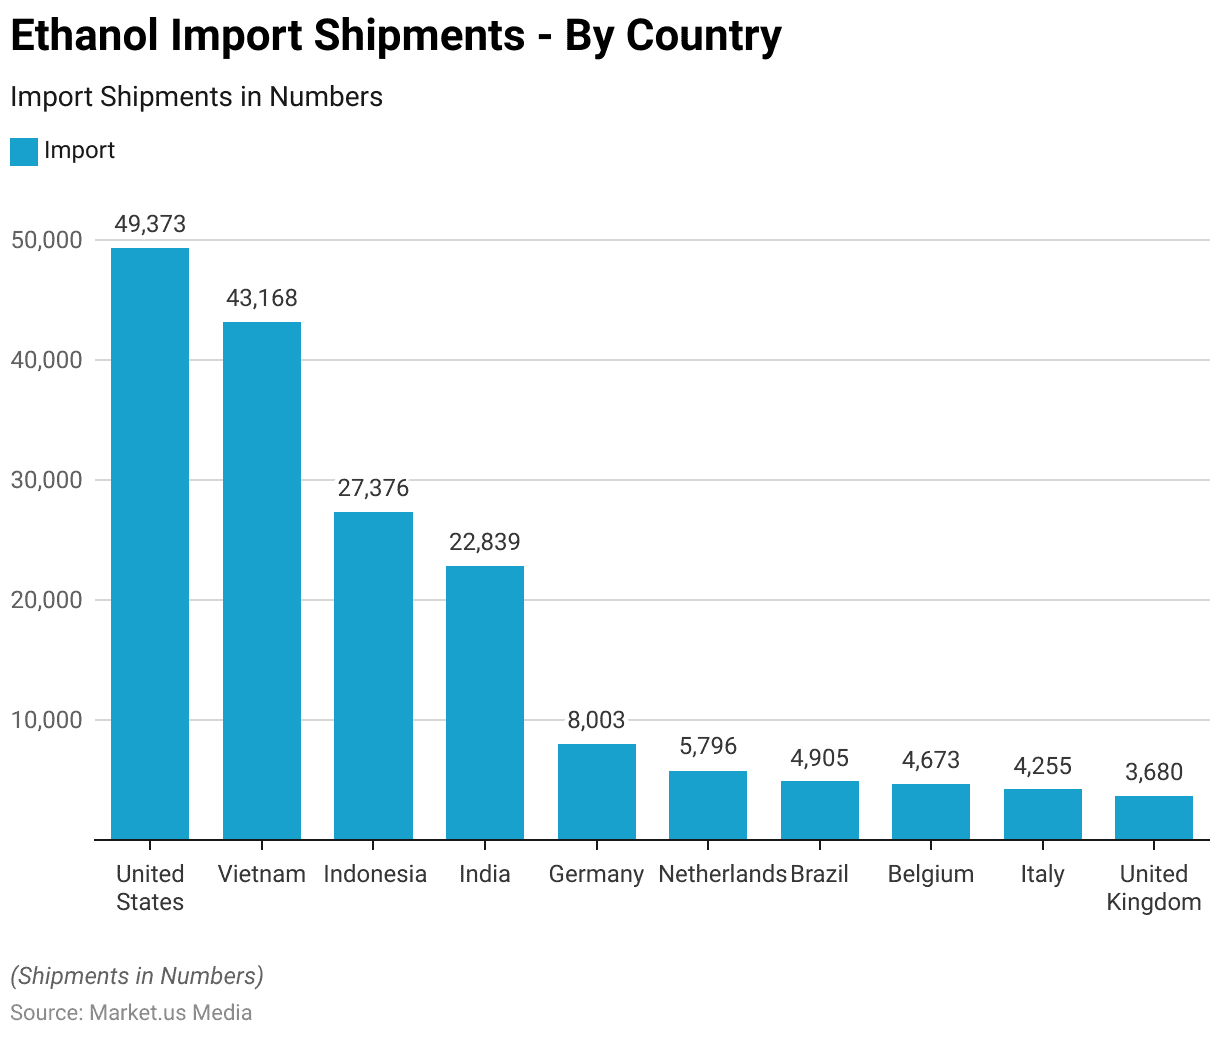
- Ethanol imports were distributed across several countries in varying volumes, reflecting global trade patterns and market demand.
- The United States led in imports with 49,373 shipments, followed closely by Vietnam with 43,168 shipments and Indonesia with 27,376 shipments.
- India also featured prominently, importing 22,839 shipments.
- Germany, the Netherlands, Brazil, Belgium, Italy, and the United Kingdom followed suit, importing 8,003, 5,796, 4,905, 4,673, 4,255, and 3,680 shipments of ethanol, respectively.

Ethanol Price Statistics
- In March 2024, ethanol prices experienced varying trends across different regions.
- In North America, the price of was recorded at US$0.59 per kilogram, marking a 1.7% increase from the previous period.
- Conversely, in Europe, ethanol prices rose to US$1.08 per kilogram, reflecting a 1.9% uptick.
- In Northeast Asia, however, prices decreased by 1.1% to US$0.87 per kilogram.
- Southeast Asia saw no change in prices, remaining at US$0.91 per kilogram.
- Meanwhile, in South America, ethanol prices climbed to US$0.69 per kilogram, representing a 1.5% increase.
Ethanol Compatibility in Vehicle Fleet
- China is one of the world’s top producers, and they’ve had their CN 2 standard in place since 2004, which is quite similar to Euro 2 standards. Because Euro 2 is very close to U.S. Tier 1 standards, it’s estimated that around 98% of China’s Light Duty Vehicles (LDVs) can handle E15 blends.
- This assumption is supported by the fact that E10 is widely used in China, and there’s a national standard specifically for E10 fuels.
- In Japan, they started with emissions standards similar to U.S. Tier 0 back in the early 1980s, and they gradually moved up to Tier 1 by 2000 and Tier 2 by 2005.
- LDVs registered in Japan since 2000 should be fine with E15, but the situation is less certain for older LDVs because Japan’s gasoline standard only allows for E3 blends.
Regulations for Ethanol in Different Countries
United States (US)
- Ethanol production, distribution, and blending are regulated by the Environmental Protection Agency (EPA) under the Renewable Fuel Standard (RFS) program.
- The Food and Drug Administration (FDA) oversees the use of ethanol in food, beverages, and pharmaceuticals.
- Occupational Safety and Health Administration (OSHA) sets workplace exposure limits.
European Union (EU)
- Ethanol production and use are governed by various directives and regulations, including those related to renewable energy, transportation fuels, and food safety.
- The European Chemicals Agency (ECHA) regulates under the Registration, Evaluation, Authorization, and Restriction of Chemicals (REACH) framework.
- The European Food Safety Authority (EFSA) evaluates the safety used in food and beverages.
Brazil
- Ethanol production is regulated by the National Agency of Petroleum, Natural Gas, and Biofuels (ANP) and the Ministry of Mines and Energy (MME).
- The National Health Surveillance Agency (ANVISA) oversees the use of food, beverages, and pharmaceuticals.
Canada
- Ethanol production and use are regulated by various federal and provincial agencies, including Natural Resources Canada (NRCan), Environment and Climate Change Canada (ECCC), and Health Canada.
- The Canadian Food Inspection Agency (CFIA) regulates ethanol use in food and beverages.
Discuss your needs with our analyst
Please share your requirements with more details so our analyst can check if they can solve your problem(s)