


Introduction
According to Ready Meals Statistics, Ready meals, also known as convenience food, are pre-packaged meals requiring minimal preparation before consumption.
They’ve surged in popularity due to their convenience, catering to busy lifestyles. Types include frozen, chilled, and canned options.
Market trends indicate a growing demand, particularly for healthier and ethnically diverse choices, alongside a rise in premium offerings.
Key players range from multinational corporations like Nestlé to local and private-label brands. Consumers prioritize convenience, nutrition, flavor variety, and eco-friendly packaging.
In summary, ready meals offer quick, easy solutions for modern life, with a market evolving to meet diverse preferences.
Editor’s Choice
- By 2033, the ready meals market revenue is projected to reach USD 297 billion.
- North America holds the largest share, commanding 41.0% of the market, which underscores its dominant position in the ready meals sector.
- In the competitive landscape of the global ready meals market, Nestle leads with a 12% share.
- China leads the ready-to-eat meals market with a substantial revenue of USD 149 billion.
- In 2024, the average per capita volume of ready-to-eat meals is expected to rise to 11.1 kilograms.
- The price per unit of ready-to-eat meals is expected to reach USD 7.74 by 2028.
- Presently, one in every five ready meals available is either plant-based or vegetarian, indicating a significant shift in consumer preferences.
Global Ready Meals Market Overview
Global Ready Meals Market Size
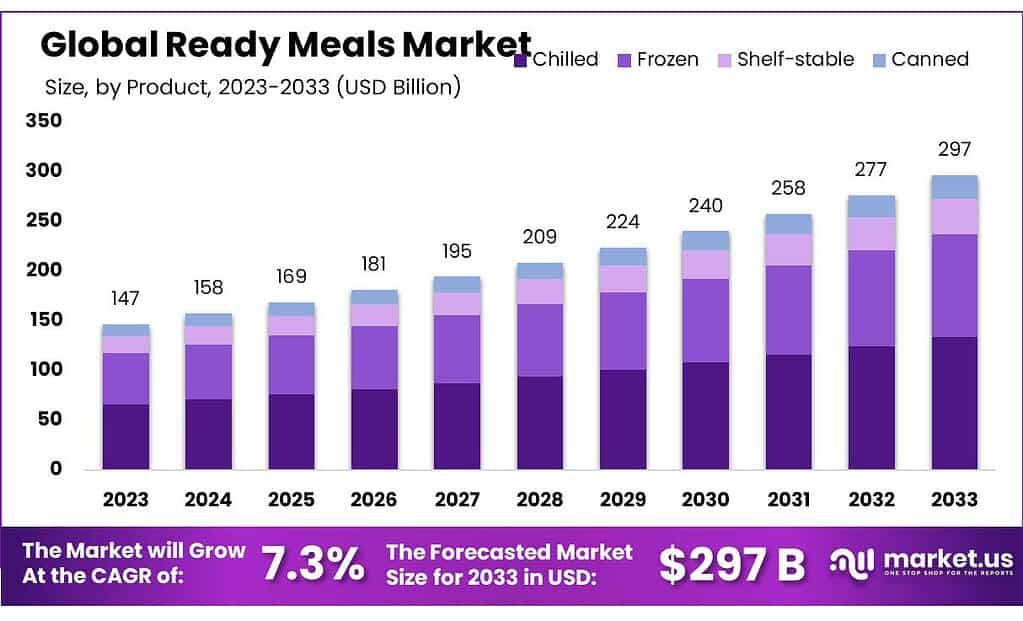
- The global market revenue for ready meals has been forecasted to demonstrate significant growth over the decade from 2023 to 2033 at a CAGR of 7.3%.
- In 2023, the market was valued at approximately USD 147 billion.
- The upward trajectory is set to continue in the subsequent years, with the market expected to grow to USD 258 billion in 2031 and ultimately reach around USD 277 billion in 2032.
- By 2033, the market for ready meals is projected to approach approximately USD 297 billion, marking a substantial increase over the decade and reflecting a growing consumer preference for convenience foods.

Regional Analysis of the Global Ready Meals Market
- North America holds the largest share, commanding 41.0% of the market, which underscores its dominant position in the ready meals sector.
- Europe follows with a significant 24.0% share, reflecting robust demand in this region.
- The Asia-Pacific (APAC) region, with its growing consumer base and increasing urbanization, accounts for 20.0% of the market.
- Latin America, while smaller in comparison, still maintains a notable share of 11.0%, indicating a rising preference for convenience foods.
- The Middle East and Africa (MEA), with emerging markets and evolving consumer habits, hold the smallest share at 4.0%.
Competitive Landscape of the Global Ready Meals Market
- In the competitive landscape of the global ready meals market, several key players have established substantial market shares.
- Nestle leads with a 12% share, reflecting its strong global presence and diverse product portfolio.
- Close behind are General Mills Inc. and Tyson Foods Inc., each holding 10% of the market.
- Kellogg Company and Conagra Brands Inc. are also prominent competitors, each with an 11% market share, underscoring their significant impact on the industry.
- Dr. Oetker and Green Mill Foods, with a 9% market share each, demonstrate solid performance and consumer trust. Nomad Foods, slightly smaller in scale, commands an 8% share.


Global Ready-To-Eat Meals Market Overview
Ready-To-Eat Meals Market Share – By Distribution Channel
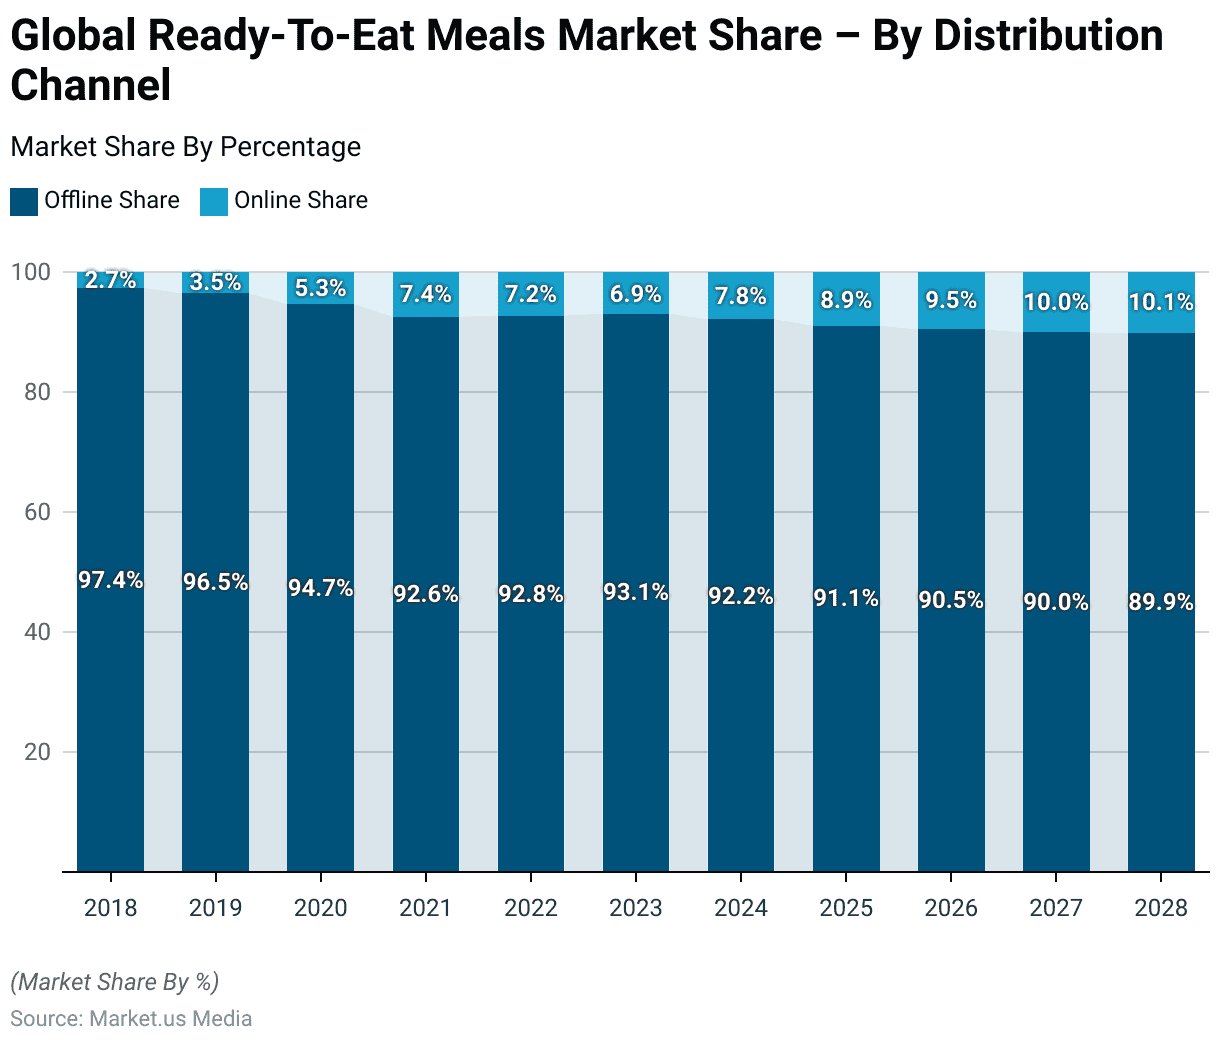
- The distribution dynamics in the global ready-to-eat meals market have significantly evolved from 2018 to 2028, with a marked shift from offline to online channels.
- Initially, in 2018, offline sales dominated the market, accounting for 97.4% of distribution, while online sales comprised only 2.7%.
- By 2019, this began to change as offline sales decreased to 96.5%, and online sales rose to 3.5%. This shift gained momentum by 2020, with offline sales reducing further to 94.7% and online sales increasing to 5.3%.
- This pattern is projected to continue, with offline shares dropping to 91.1% and online rising to 8.9% by 2025, reaching 90.5% offline and 9.5% online by 2026, and by 2028, approaching a more balanced distribution with 89.9% offline and 10.1% online.
Global Ready-To-Eat Meals Market Revenue – By Country
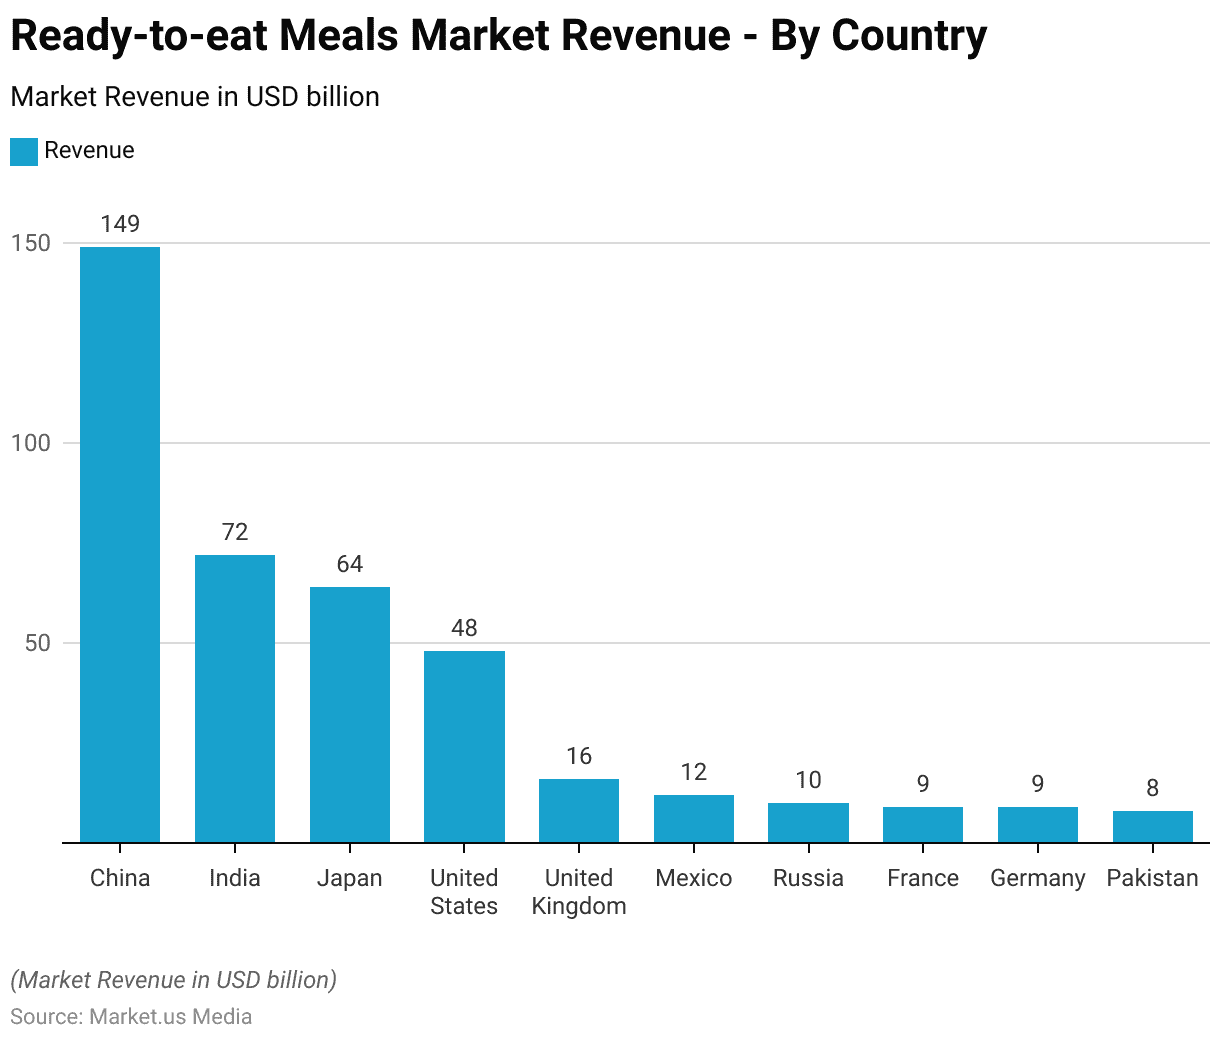
- The ready-to-eat meals market exhibits varied revenue figures across different countries, highlighting distinctive consumption patterns and market sizes.
- China leads with a substantial market revenue of USD 149 billion, reflecting its large population and increasing consumer demand for convenience foods.
- India follows with a significant revenue of USD 72 billion due to its growing urbanization and changing lifestyle trends.
- Japan also holds a considerable portion of the market, generating USD 64 billion, supported by its high consumer spending on convenience foods.
- In the United States, the market revenue stands at USD 48 billion, indicative of a robust demand for ready-to-eat options.
- The United Kingdom contributes USD 16 billion, while Mexico’s market is slightly smaller at USD 12 billion.

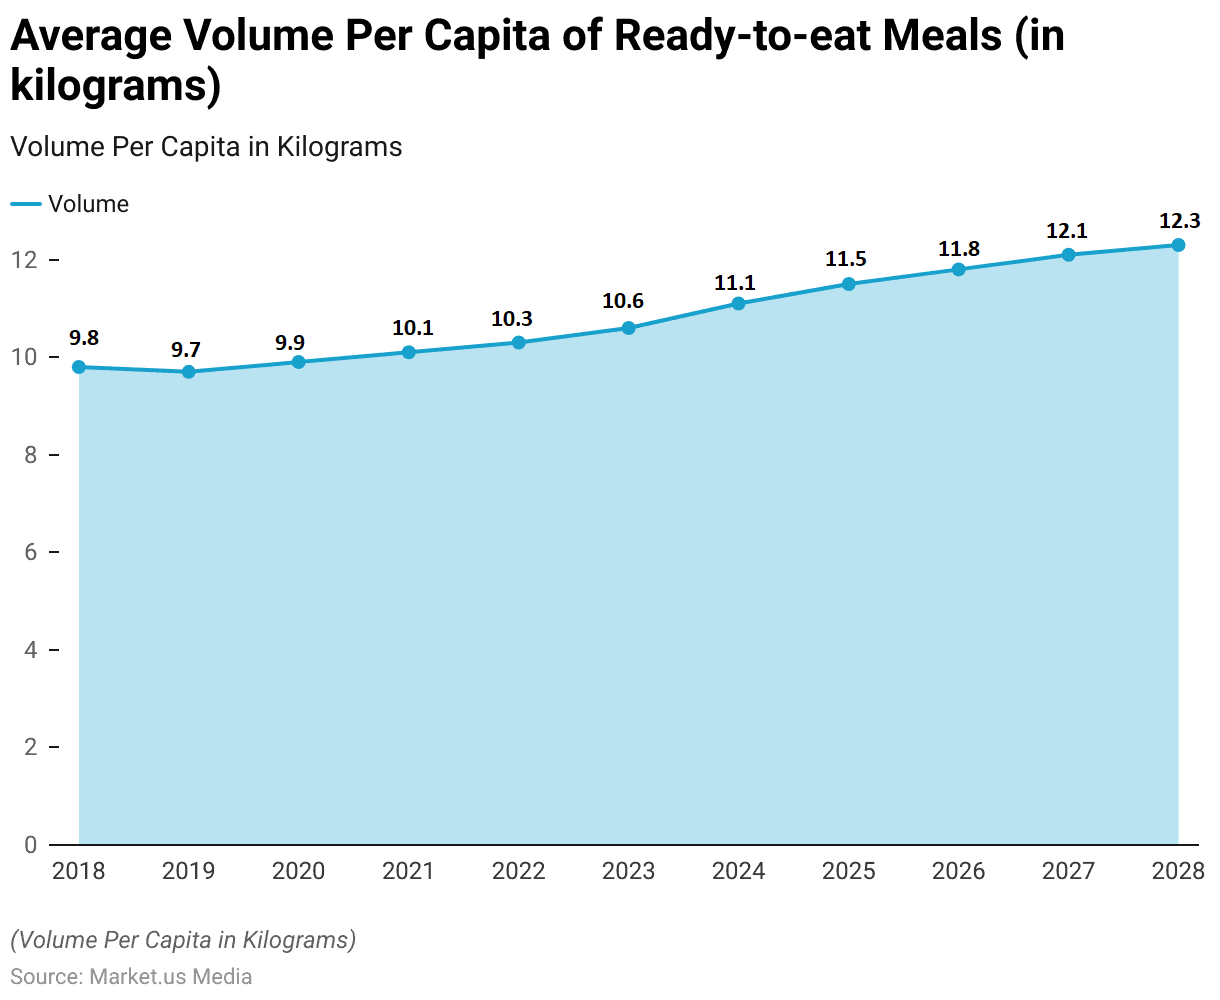
Average Volume Per Capita of Ready-to-eat Meals
- The average volume per capita of ready-to-eat meals has shown a progressive increase from 2018 through 2028.
- In 2018, the consumption per capita was measured at 9.8 kilograms.
- The upward trend continued steadily, with volumes reaching 10.1 kilograms in 2021 and further increasing to 10.3 kilograms in 2022.
- By 2023, the per capita volume had grown to 10.6 kilograms, and projections show accelerated growth in the subsequent years.
- The trend is anticipated to continue, with volumes growing to 11.8 kilograms in 2026, 12.1 kilograms in 2027, and eventually stabilizing at 12.3 kilograms by 2028.
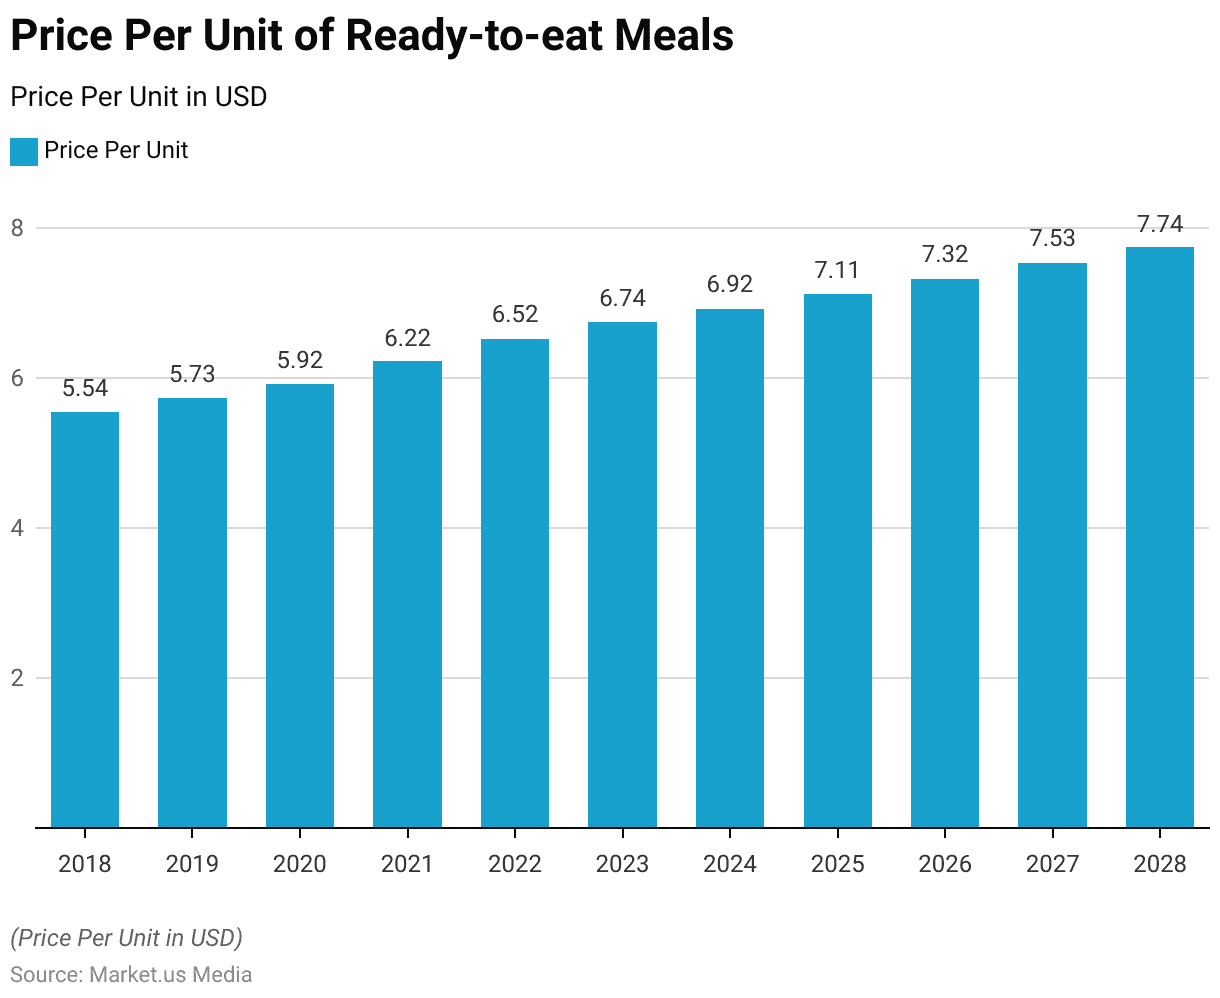
Price of Ready-to-eat Meals
- The price per unit of ready-to-eat meals has shown a consistent upward trend from 2018 through 2028.
- Starting at $5.54 per unit in 2018, there has been a gradual increase each year. In 2019, the price rose slightly to $5.73, followed by an increment to $5.92 in 2020.
- By 2023, the price per unit had increased to $6.74, reflecting ongoing market adjustments and inflationary pressures.
- The price is expected to continue its upward trajectory, reaching $7.53 in 2027 and $7.74 by 2028.

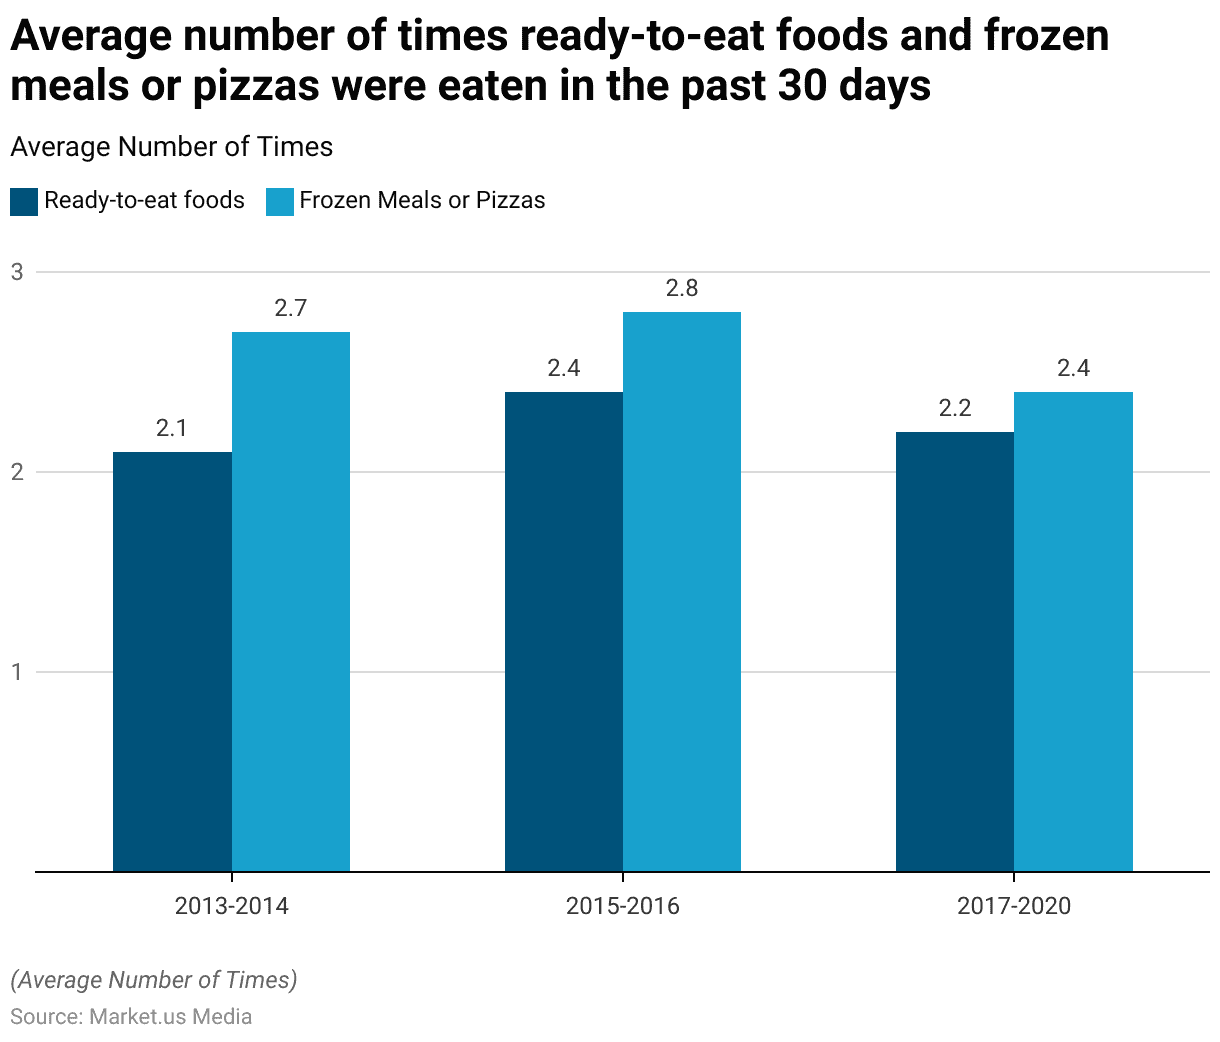
Average Consumption of Ready-To-Eat Foods and Frozen Meals or Pizzas
- Over the period from 2013 to 2020, there has been noticeable variability in the consumption patterns of ready-to-eat foods and frozen meals or pizzas.
- In the years 2013-2014, the average number of times ready-to-eat foods were consumed in the past 30 days stood at 2.1, while frozen meals or pizzas were consumed slightly more frequently at an average of 2.7 times.
- However, from 2017 to 2020, there was a slight decline in consumption rates; ready-to-eat foods were consumed 2.2 times, and frozen meals or pizzas dropped to an average of 2.4 times.

Consumer Behaviour and Trends
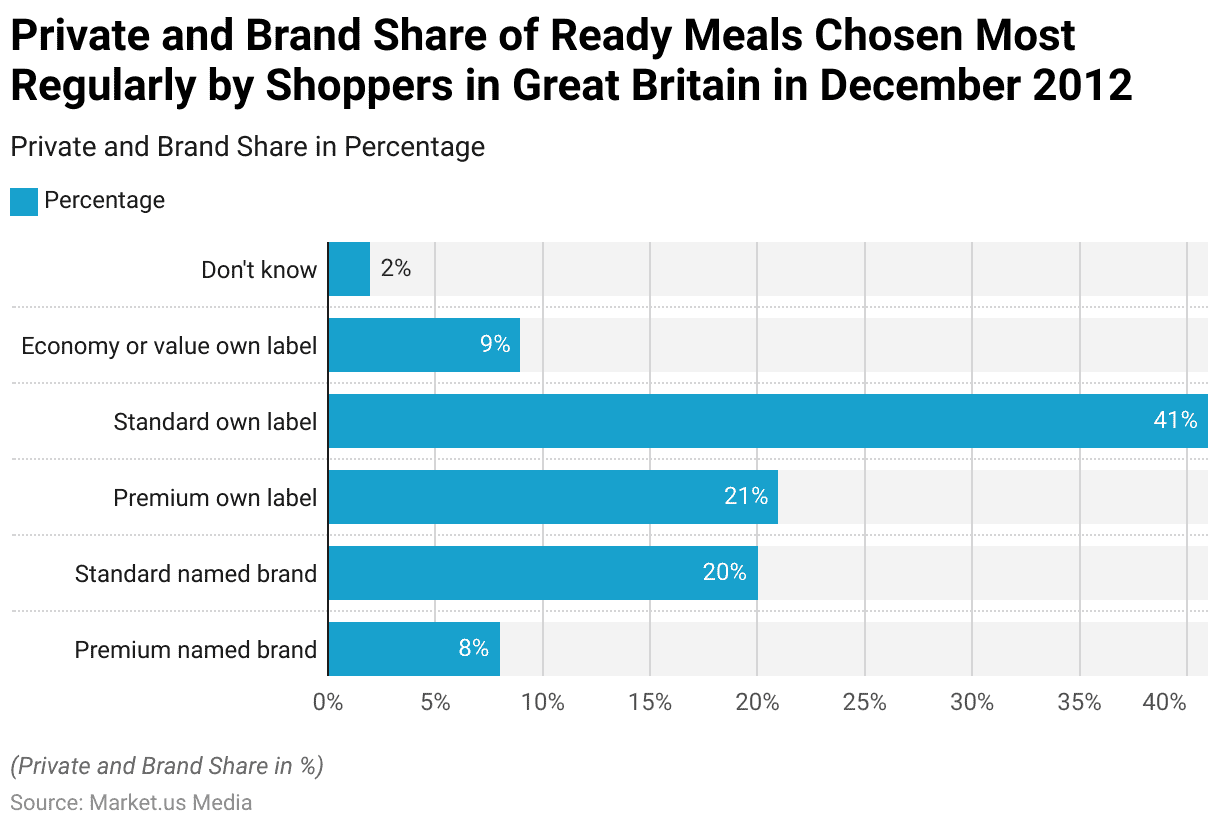
Ready Meal Brand Preferences Among Shoppers
- In December 2012, the distribution of meals chosen most regularly by shoppers in Great Britain revealed distinct consumer preferences.
- Premium-named brands were chosen by 8% of respondents, while standard-named brands were more popular and selected by 20% of shoppers.
- Own-label products, however, dominated the market preferences. Premium own-label ready meals were chosen by 21% of consumers, but it was the standard own-label options that held the largest share, preferred by 41% of the shoppers.
- Additionally, economy or value-own-label products were selected by 9% of respondents.

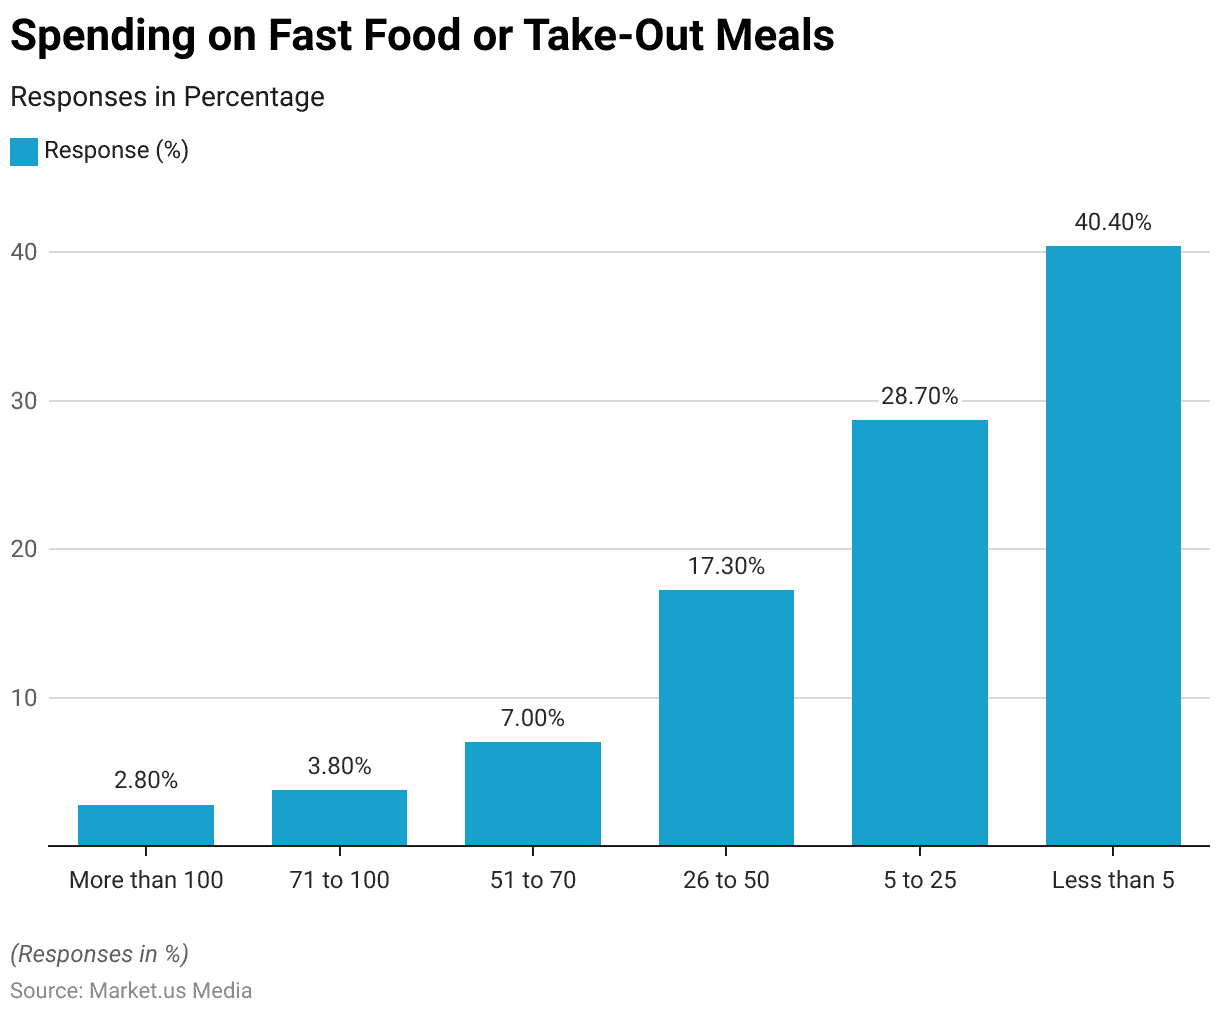
Spending on Fast Food or Take-Out Meals
- A significant portion of respondents, 40.4%, reported spending less than $5, indicating a conservative approach to expenditure on these types of meals.
- The next largest group, comprising 28.7% of participants, spends between $5 and $25, suggesting a moderate but more frequent indulgence in fast food or take-out.
- Those spending between $26 and $50 represent 17.3% of the survey population, showing a willingness to allocate a reasonable portion of their budget to convenience dining.
- A smaller segment, 7%, spends between $51 and $70, while 3.8% allocate between $71 and $100 to such meals, reflecting a higher but less common spending threshold.
- The smallest group, at 2.8%, spends more than $100, indicating a significant commitment to fast food or take-out meals among a minor subset of consumers.
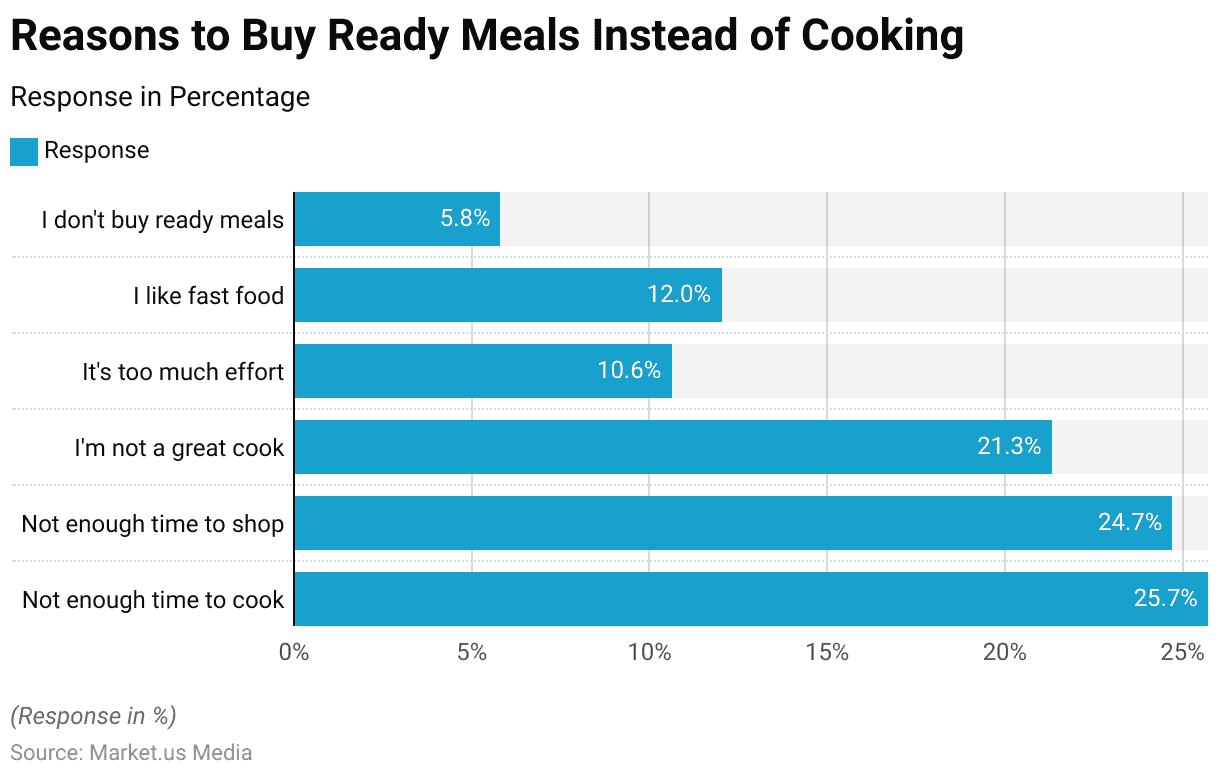
Reasons to Buy Ready Meals Instead of Cooking
- The leading reason, reported by 25.7% of respondents, is not having enough time to cook, indicating a significant demand for convenience.
- Closely following, 24.7% of individuals cited the lack of time to shop for groceries as their main reason, which further underscores the need for quick and easy meal solutions.
- Additionally, 21.3% of participants admitted to purchasing ready-to-cook meals because they do not consider themselves great cooks, suggesting that skill level is a notable factor in food choices.
- About 12% of respondents expressed a preference for fast food simply because they like it, while 10.6% described cooking as too much effort.
- Interestingly, a small portion of the surveyed population, 5.8%, stated that they do not buy ready meals at all, highlighting a minority that either prefers to cook or chooses other options.

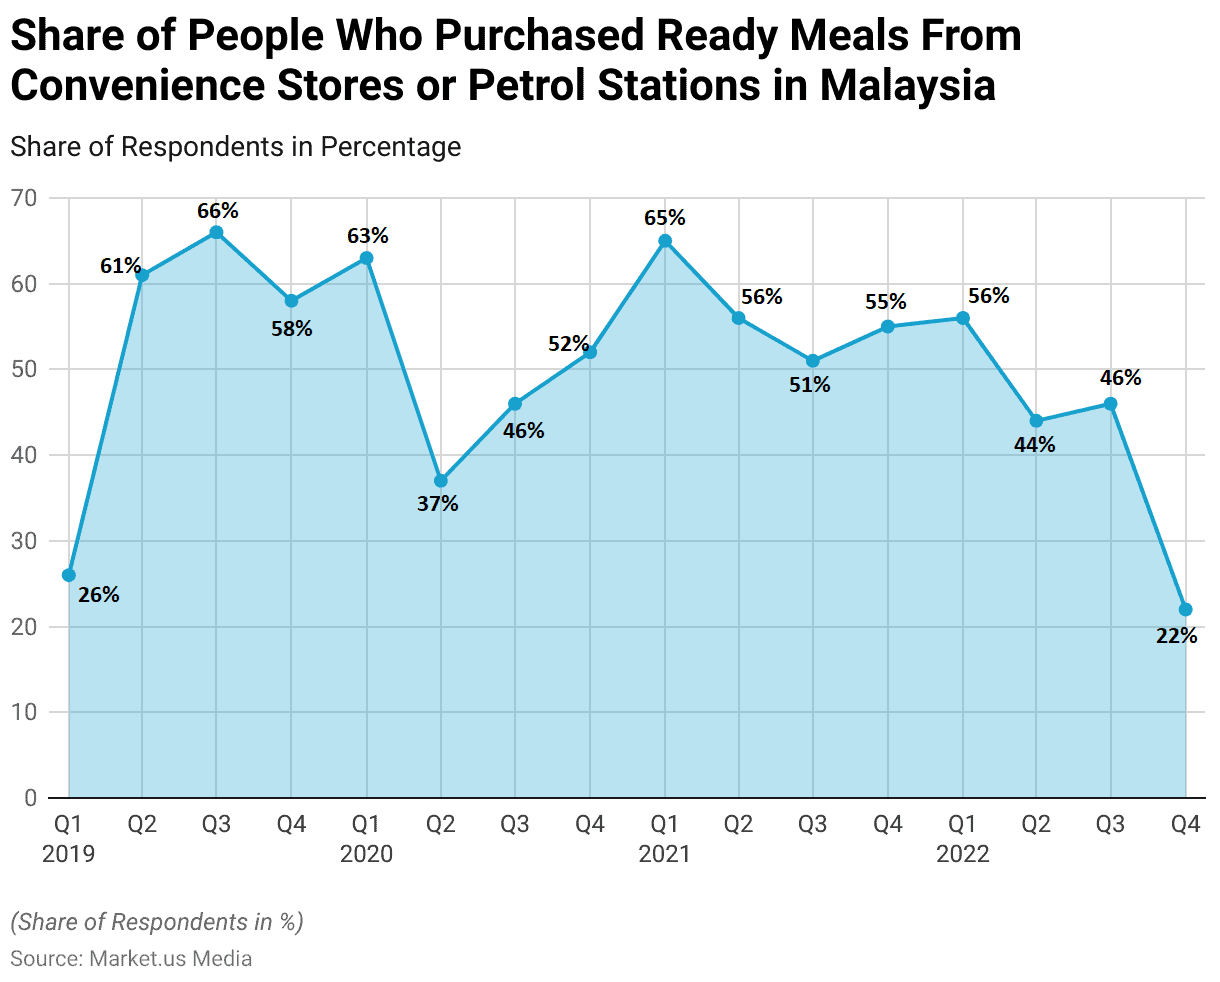
Purchasing Preferences
- Between the first quarter of 2019 and the fourth quarter of 2022, the percentage of people in Malaysia purchasing ready meals from convenience stores or petrol stations exhibited notable fluctuations.
- The trend started with 26% of respondents in Q1 2019, which saw a significant increase to 61% by Q2 2019 and peaked at 66% in Q3 2019. By the end of 2019, the share had decreased slightly to 58%.
- In 2022, the purchasing rate maintained a level of 56% in Q1, dropped to 44% in Q2, remained stable at 46% in Q3, and then saw a significant drop to 22% by Q4 2022.
New Trends in Preferences for Plant-based Meals
- The plant-based meal category has experienced remarkable growth, soaring by 92% since 2018.
- Over the same period, there has been a notable 50% surge in plant-based and vegetarian meal options.
- Presently, one in every five meals available is either plant-based or vegetarian, indicating a significant shift in consumer preferences.
- Moreover, these plant-based and vegetarian options are now priced as the most economical choices across various retailers.
- Notably, major supermarkets such as ALDI and Tesco have substantially expanded their plant-based offerings, with ALDI witnessing a remarkable 175% increase, now constituting a quarter of its ready meals range.
Discuss your needs with our analyst
Please share your requirements with more details so our analyst can check if they can solve your problem(s)