


Table of Contents
Introduction
Herbal Tea Statistics: Herbal tea, known as tisane, comprises a diverse range of caffeine-free brews derived from botanical ingredients like chamomile, peppermint, ginger, lemon balm, and echinacea. When infused in hot water, these herbs yield various flavors and potential health benefits.
Chamomile induces relaxation, peppermint aids digestion, ginger provides warmth and comfort, lemon balm relieves stress, and echinacea enhances immune function. Herbal teas can be hot or cold and sweetened to suit individual preferences.
While generally deemed safe, consuming them moderately and consulting with a healthcare professional is recommended, especially for individuals with health concerns or using medicinal spices.
Essentially, herbal tea presents a delightful and healthful beverage option appreciated worldwide for its natural attributes and versatility.

Editor’s Choice
- The global herbal tea market revenue is anticipated to reach USD 6.9 billion by 2032.
- Among the popular flavors, chamomile holds the largest market share at 34%. Appreciated for its soothing properties and delicate floral aroma.
- Herbal tea typically contains negligible amounts of saturated fat, measuring up to 0.005g, constituting 0% of the recommended daily intake.
- China leads the pack with a commanding export share of 25.41%, totaling a substantial export value of USD 2008 million.
- Pakistan emerges as a leading importer, commanding an import share of 11.38% and importing herbal tea valued at USD 640.57 million.
- Global green tea production reached an estimated 2.1 million metric tons (MMT) in 2021.
- In 2018, the United States Tea Association reported that approximately 84% of tea consumption in the United States was attributed to black tea.
Herbal Tea Market Overview
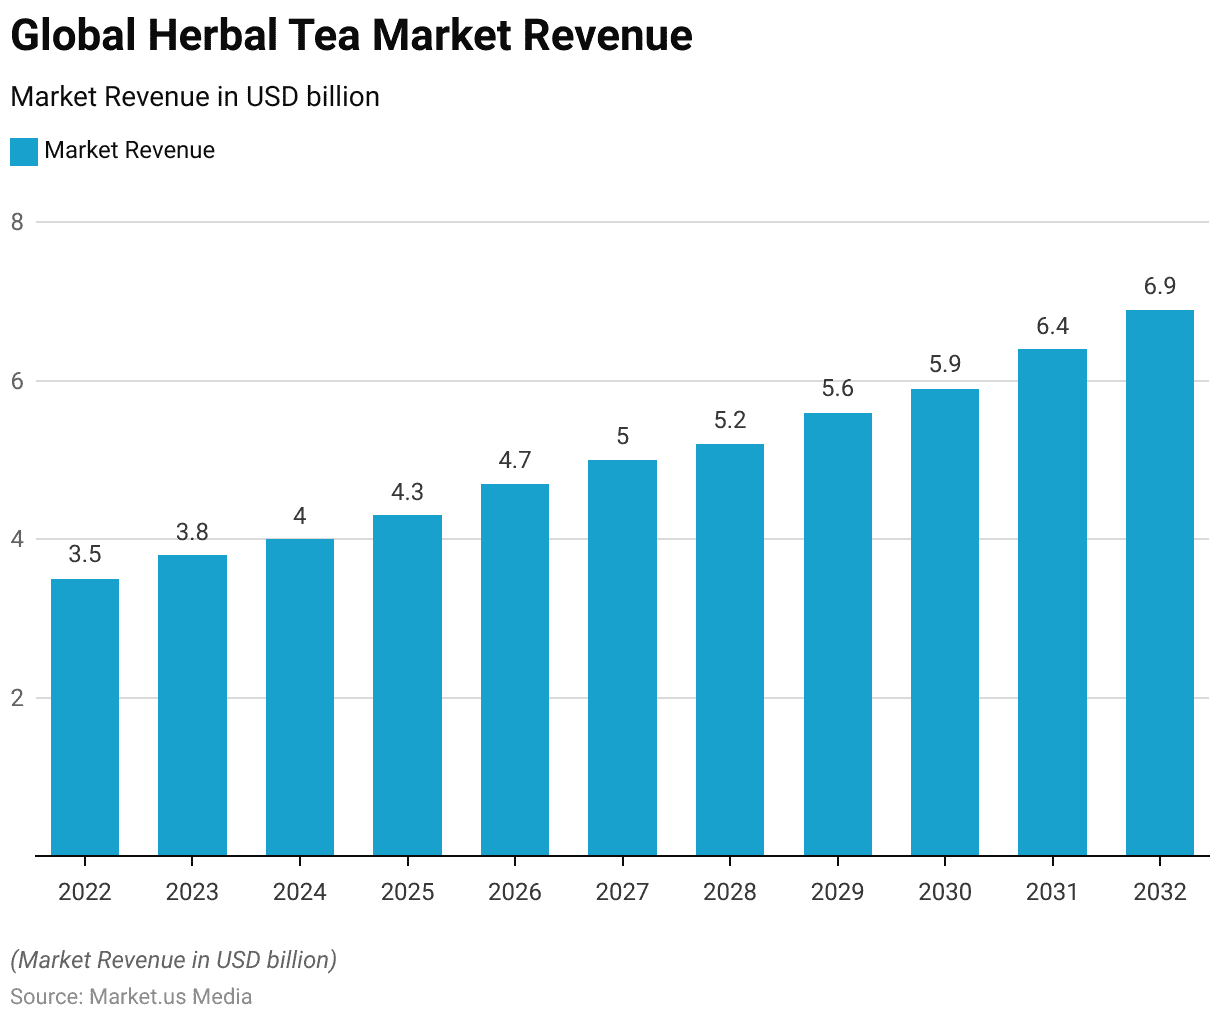
Global Herbal Tea Market Size Statistics
- The global herbal tea market has demonstrated consistent growth over the years at a CAGR of 7.2%. With revenue steadily increasing from 3.5 billion USD in 2022 to an estimated 6.9 billion USD by 2032.
- This upward trajectory reflects a growing consumer interest in natural and health-promoting beverages.
- In 2023, the market revenue rose to 3.8 billion USD, followed by further expansion to 4.0 billion USD in 2024 and 4.3 billion USD in 2025.
- The trend continues with projected revenues of 4.7 billion USD in 2026, 5.0 billion USD in 2027, and 5.2 billion USD in 2028.
- By 2029, the market is expected to reach 5.6 billion USD. Followed by 5.9 billion USD in 2030 and 6.4 billion USD in 2031.
- Finally, by the end of 2032, the global herbal tea market is anticipated to reach a significant milestone of 6.9 billion USD in revenue. Highlighting the sustained growth and appeal of herbal tea products worldwide.
(Source: Market.us)

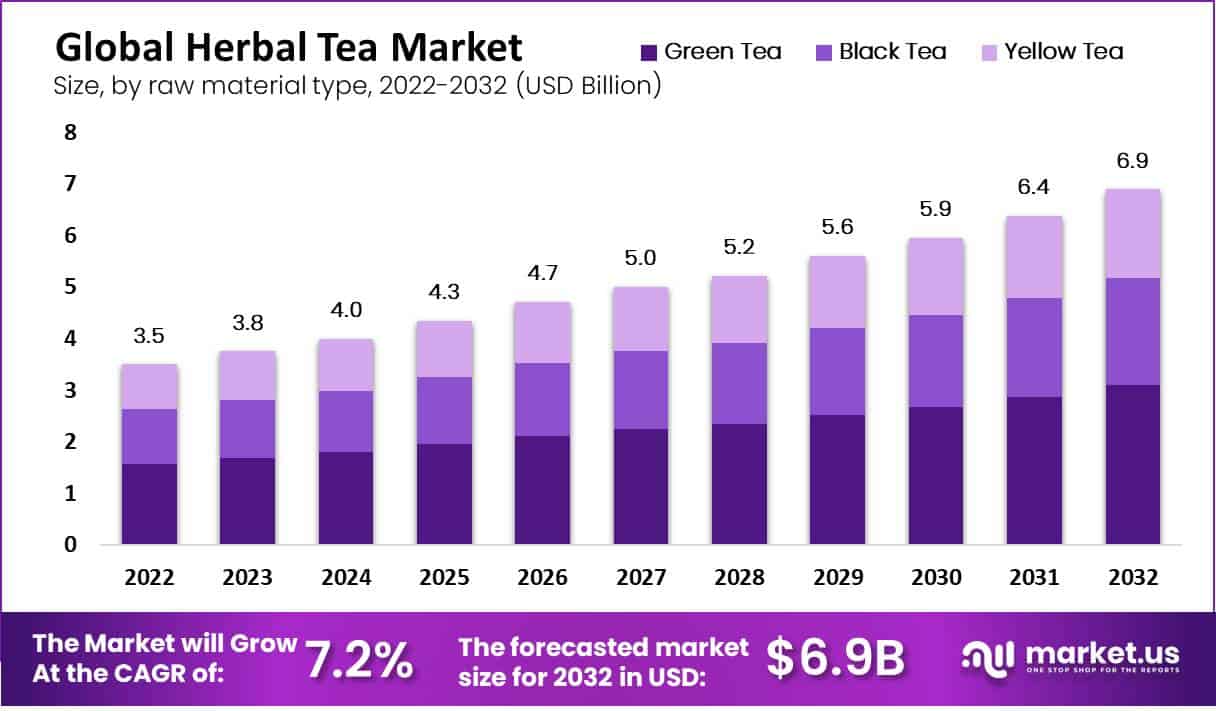
Global Herbal Tea Market Size – By Raw Material Type Statistics
- The global herbal tea market, segmented by raw material type, has steadily grown over the analyzed period.
- Beginning at 3.5 billion USD in 2022, the total market revenue increased gradually, reaching 6.9 billion USD by 2032.
- This growth was mirrored by the revenue generated from green, black, and yellow tea. In 2022, green tea accounted for 1.58 billion USD, black tea for 1.05 billion USD, and yellow tea for 0.88 billion USD.
- By 2032, these figures had risen substantially, with green tea revenue at 3.11 billion USD. Black tea at 2.07 billion USD, and yellow tea at 1.73 billion USD.
- The consistent upward trend in revenue across all tea types underscores the global demand and popularity of herbal teas. Indicating a promising outlook for the market in the foreseeable future.
(Source: Market.us)

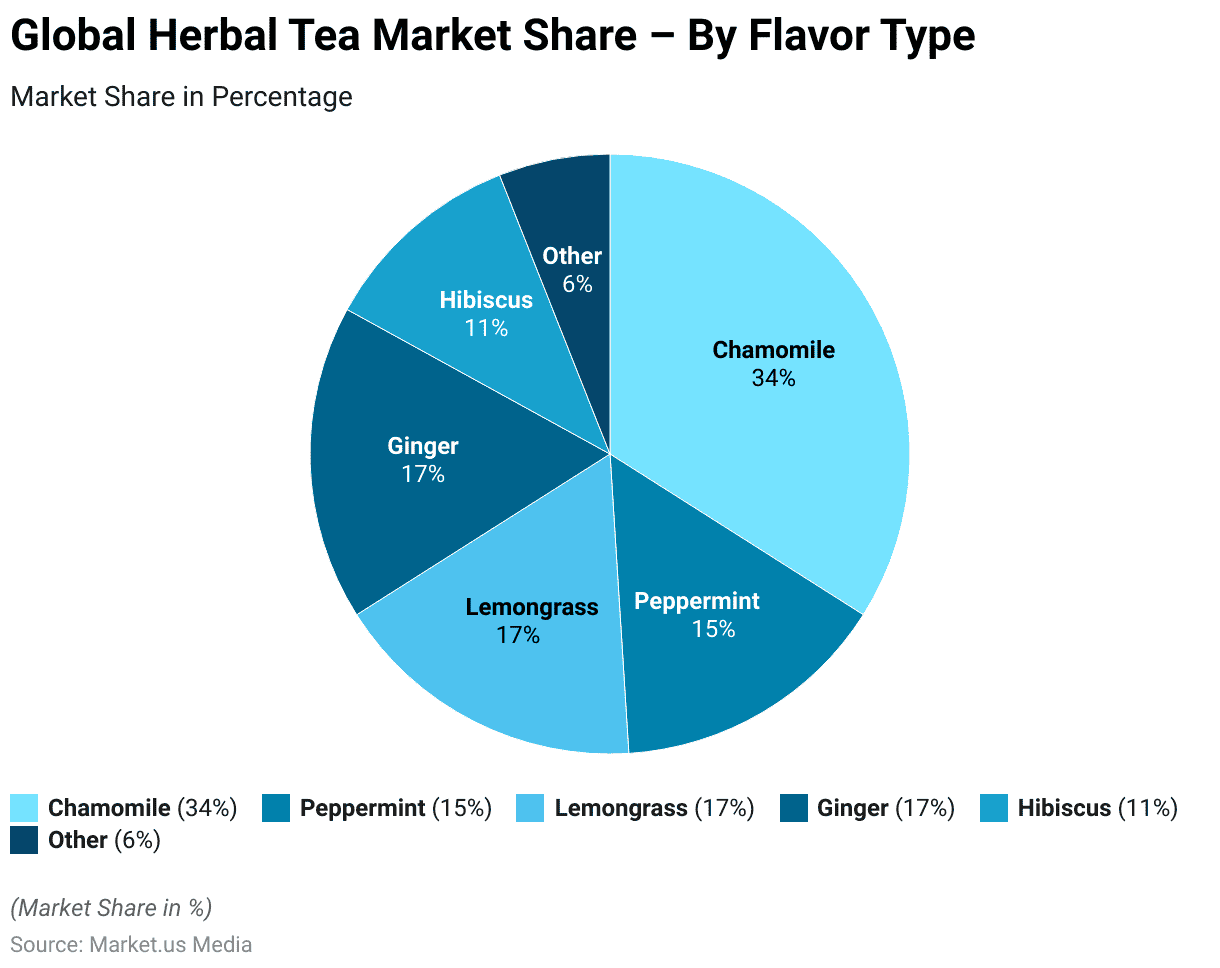
Global Herbal Tea Market Share – By Flavor Type Statistics
- In the herbal tea market, flavor preferences play a significant role, with various options appealing to consumer tastes.
- Among the popular flavors, chamomile holds the largest market share at 34%, appreciated for its soothing properties and delicate floral aroma.
- Peppermint follows, capturing 15% of the market, valued for its refreshing taste and digestive benefits.
- Lemongrass and ginger share an equal market share of 17%, with lemongrass offering a citrusy zest. Ginger provides a warm, spicy note, contributing to herbal teas’ diverse flavor profile.
- Hibiscus, known for its tart and tangy flavor, holds an 11% market share.
- The remaining 6% is attributed to other flavors, highlighting the breadth of options consumers have.
- This distribution underscores the importance of flavor diversity in satisfying consumer preferences and driving continued growth in the herbal tea market.
(Source: Market.us)
Nutritional Value of Herbal Tea
- Regardless of the herbal tea you enjoy, each variety offers significant nutritional benefits. Herbal teas are packed with valuable nutrients.
- The nutritional content is based on a standard serving size of one mug, typically around eight fluid ounces or approximately 100 grams.
- Herbal tea typically contains negligible amounts of saturated fat, measuring up to 0.005g, constituting 0% of the recommended daily intake.
- Similarly, it contains minimal monounsaturated fat (up to 0.012g) and polyunsaturated fat (up to 0.002g).
- The cholesterol content in herbal tea is non-existent, registering at 0mg, representing 0% of the recommended intake.
- Sodium and potassium content in herbal tea are also minimal, typically reaching 2mg and 21mg, respectively.
- Notably, herbal tea lacks dietary fiber and sugars. However, it contains essential vitamins such as Vitamins A and C.
(Source: Lybrate)
Herbal Tea Export Statistics
- The global export landscape of herbal tea is marked by significant contributions from various countries in 2022.
- China leads the pack with a commanding export share of 25.41%, totaling a substantial export value of USD 2008 million.
- Following closely behind, Kenya claims a significant portion of the market, with an export share of 16.89%, equating to USD 1380 million.
- Sri Lanka also boasts a notable presence, accounting for 15.93% of global exports, equivalent to USD 1310 million.
- Further diversifying the market, India holds a respectable 9.16% share, translating to an export value of USD 751.06 million.
- The United Arab Emirates (UAE) stands out with a 5.36% export share, generating USD 439.42 million in revenue.
- Other noteworthy contributors include Poland (3.08%, USD 252.69 million), Germany (2.87%, USD 235.36 million), Vietnam (2.72%, USD 223.09 million), Japan (2.06%, USD 169.19 million), and the UK (1.50%, USD 123.32 million).
- These statistics underscore the global demand for herbal tea, with diverse origins catering to a growing consumer base.
(Source: Tridge)

Herbal Tea Import Statistics
- The import dynamics of herbal tea reveal a diverse distribution among several key importing nations in 2022.
- Pakistan emerges as a leading importer, commanding an import share of 11.38% and importing herbal tea valued at USD 640.57 million.
- Following closely behind, the United States holds a significant share of the import market. Accounting for 9.94% of imports, equating to USD 559.66 million.
- The United Kingdom also plays a notable role, representing 6.32% of imports with a value of USD 355.79 million.
- Egypt follows suit with a 4.84% import share, amounting to USD 272.65 million worth of herbal tea imports.
- The United Arab Emirates and Morocco each claim around 4.63% and 4.55% import shares, respectively, with import values of USD 260.8 million and USD 256.16 million.
- Germany closely trails, accounting for 4.54% of imports totaling USD 255.68 million.
- Other significant importers include Hong Kong (4.07%, USD 229.25 million), Kuwait (3.13%, USD 176.4 million), and France (3.03%, USD 170.59 million).
- These import statistics underscore the global demand for herbal tea, with various countries contributing to a thriving international market.
(Source: Tridge)

Green Tea Statistics
Global Green Tea Exports
- China dominates the global market for green tea exports, with its 2021 exports reaching 0.31 MMT, comprising nearly 85% of its total exports.
- Regarding value, green tea exports comprise about 60% of China’s total export revenue. China’s average annual export rates stand at $5.55/kg. Green tea averages $4.44/kg, and black tea at $10.25 /kg.
- Morocco remains China’s primary export partner due to its high per-capita tea consumption and strong tradition of consuming green tea, such as Moroccan mint tea.
- Vietnam emerged as a notable green tea exporter, although its volumes are considerably smaller than China’s. In 2021, Vietnam exported 62,000 MT of green tea, nearly half its total exports.
- Renowned for its green tea production, Japan exported over 6,000 MT of predominantly green tea. With approximately one-third of this quantity destined for the US.
- Additionally, Indonesia, Sri Lanka, and India contribute to green tea exports, each ranging from 5,500 to 3,000 MT.
- Indonesia’s primary export partners are Malaysia, Russia, and the US, while Sri Lanka mainly exports to Turkey, Iraq, and Russia. India’s main export destinations include Russia, Iran, and the UAE.
(Source: International Tea Committee)
Global Green Tea Imports
- In 2021, the global green tea import market saw several countries emerge as leading importers based on trade value in million U.S. dollars.
- Topping the list was the United States, importing green tea worth USD 110.94 million. Followed by China, including Hong Kong SAR, with imports totaling USD 80.38 million.
- France secured the third position, importing green tea valued at USD 67.23 million, while Canada and the Netherlands followed closely with import values of USD 35.01 million and USD 32.53 million, respectively.
- Malaysia, Germany, Italy, Spain, and Belgium contributed substantially to global green tea imports. With trade values ranging from USD 18.8 million to USD 25.69 million.
- These figures underscore the widespread international demand for green tea across various regions.
(Source: Statista)

Global Green Tea Production
- The International Tea Committee (ITC) reports a rise in green tea production share, increasing from approximately 30% to 33%.
- Global green tea production reached an estimated 2.1 million metric tons (MMT) in 2021, with China leading the pack at over 1.8 MMT, representing more than 85% of the global output.
- Green tea constitutes roughly 60% of China’s total annual production, surpassing black tea, which accounts for about 14% of China’s yearly output.
- Japan, the second-largest producer of green tea, contributes around 0.8 million metric tons (MMT) annually. Sencha and bancha are the primary types, with sencha representing slightly over half and bancha comprising more than a third of Japan’s green tea output.
- Matcha (tencha) and gyokuro comprise less than 4% of the total volume but command a higher average value per kilogram than sencha.
- Other major tea-producing countries like India, Argentina, Indonesia, Sri Lanka, Turkey, and Vietnam combine green tea production with black or primarily focus on reporting green tea exports.
(Source: International Tea Committee)
Black Tea Consumption and Benefits
- In 2018, the United States Tea Association reported that approximately 84% of tea consumption in the United States was attributed to black tea.
- Antioxidants play a role in neutralizing free radicals; tea is a notable source of these compounds. Research indicates that phenolic compounds, known for their antioxidant properties, make up to 30% of the dry weight of green and black tea, as highlighted in a particular study.
- Research conducted on hamsters in 2004 indicated that consuming black tea or green tea at doses equivalent to those for humans could potentially inhibit the onset of atherosclerosis. However, further studies involving human subjects are required to validate these findings.
- In 2013, researchers discovered indications indicating that individuals who consumed four or more cups of black tea daily had a reduced likelihood of experiencing a stroke.
- A study conducted in 2015 indicated that black tea might lower both systolic and diastolic blood pressure levels.
- Studies indicate that drinking tea could potentially reduce the risk of diabetes. In one study, individuals with type 2 diabetes received varying doses of black tea extract over four weeks.
- The researchers found that regularly drinking black tea might offer antioxidative and anti-inflammatory benefits for people with this condition.
(Source: PubMed, ACS Publications, ScienceDirect, United States Tea Association, MDPI)
Consumer Trends and Preferences
- A lifestyle survey conducted by the Tea Council of the USA in June 2015 discovered that 86% of Americans prefer green tea, while 59% opt for black, white, and oolong teas.
- Furthermore, green tea consumption has experienced significantly faster growth compared to black tea, increasing by 60% in volume over the past decade until 2014, according to the council’s findings.
- Green tea currently constitutes approximately 15% of total tea consumption in the US, with the remainder comprising oolong, white, and dark teas.
- A survey of 600 individuals in Tokyo focused on their green tea consumption habits. Results revealed that 72.3% of Japanese individuals drink green tea daily, while 89.6% consume it more than once a week.
- Interestingly, as individuals age, there is a notable increase in the preference for green tea. For instance, only 48% of those in their twenties drink green tea daily, whereas the figure rises to 94% for individuals over 50.
- Additionally, there is a trend indicating that women tend to drink tea more frequently than men.
(Source: Tea Council of the USA, O-CHANET)
Recent Developments
Acquisitions and Mergers:
- Consolidation Among Herbal Tea Brands:
- Several acquisitions and mergers have reshaped the herbal tea market landscape, with approximately 3 major deals reported in the last six months.
- These strategic moves aim to leverage synergies and expand market presence, indicating a trend toward consolidation in the industry.
New Product Launches:
- Proliferation of Functional and Specialty Herbal Tea Varieties:
- Over 30 new herbal tea products have been introduced. Featuring innovative blends targeting specific health benefits and flavor profiles.
- Notable launches include herbal teas infused with adaptogenic herbs for stress relief and immunity-boosting botanicals to meet the growing consumer demand for wellness-oriented beverages.
Funding and Investments:
- Surge in Investment in Herbal Tea Startups:
- Herbal tea startups have attracted significant funding, with total investment reaching approximately $15 million in the past year.
- Investors are increasingly bullish on the growth potential of herbal tea brands capitalizing on the rising consumer interest in natural and functional beverages.
Market Expansion Initiatives:
- Global Expansion Strategies by Leading Herbal Tea Companies:
- Key players in the herbal tea market have initiated aggressive expansion plans to tap into new geographic markets and capitalize on evolving consumer preferences.
- International sales of herbal tea products have witnessed a 20% increase year-on-year. Driven by expansion into emerging markets in Asia and Europe.
Technological Advancements:
- Adoption of Sustainable Packaging Solutions:
- Herbal tea manufacturers are embracing eco-friendly packaging materials and innovative designs to reduce environmental impact and meet consumer demand for sustainability.
- Approximately 40% of herbal tea brands have shifted to recyclable or biodegradable packaging, leading to a 15% reduction in carbon footprint.
Health and Wellness Trends:
- Growing Demand for Herbal Tea with Functional Benefits:
- Consumer interest in herbal teas with functional benefits such as digestion support, relaxation, and detoxification continues to drive market growth.
- Sales of functional herbal tea blends have surged by 30% year-on-year, fueled by health-conscious consumers seeking natural remedies and holistic wellness solutions.
Partnerships and Collaborations:
- Collaboration with Wellness Influencers and Celebrities:
- Herbal tea brands are partnering with wellness influencers and celebrities to enhance brand visibility and credibility among target demographics.
- Collaborative marketing campaigns and endorsements have resulted in a 25% increase in social media engagement and brand awareness.
Conclusion
Herbal Tea Statistics – The global herbal tea market is experiencing significant growth and diversification as consumers increasingly opt for natural and healthy beverage choices. Herbal tea’s perceived health benefits and wide range of flavors make it a popular option.
Market trends show a rising demand fueled by increased health awareness, greater product availability, and expanded distribution channels. Herbal teas’ adaptability —they can be enjoyed hot or cold and customized with various ingredients—further boosts their appeal.
Manufacturers and retailers are expected to seize this opportunity by introducing innovative blends and marketing strategies to meet evolving consumer preferences and lifestyle trends.
In essence, the herbal tea market shows promising prospects for growth and expansion both domestically and internationally.
FAQs
Herbal tea, also known as herbal infusion or tisane, is made from dried herbs, flowers, fruits, or spices in hot water.
No, herbal teas are not made from the leaves of the Camellia sinensis plant, which is used for traditional teas. Instead, herbal teas are made from various plants and botanicals, resulting in multiple flavors and potential health benefits.
Herbal teas are often consumed for their perceived health benefits. Which can vary depending on the herbs and ingredients used. Some common health claims associated with herbal teas include promoting relaxation, aiding digestion, boosting immunity, and providing antioxidants.
Many herbal teas are naturally caffeine-free, making them a popular choice for individuals looking to reduce their caffeine intake. However, some herbal teas may contain small amounts of caffeine if they include ingredients like yerba mate or guayusa.
While herbal teas are generally considered safe for most people, it’s essential to be aware of potential allergies or drug interactions. Pregnant or breastfeeding individuals should consult with a healthcare professional before consuming certain herbal teas, as some herbs may not be safe during pregnancy.
Discuss your needs with our analyst
Please share your requirements with more details so our analyst can check if they can solve your problem(s)