


Introduction
Rice Statistics – Rice, a staple for over half the world’s population, is a versatile cereal grain with thousands of varieties categorized into long-grain, medium-grain, and short-grain types.
From the slender and separate long-grain to the sticky short-grain varieties, rice offers diverse culinary possibilities, including plain steamed rice, sushi, and rice pudding.
While white rice is widely consumed, retaining little of its bran layer, brown rice preserves more nutrients and fiber.
Beyond its nutritional value, rice holds cultural significance, symbolizing fertility and prosperity in many societies. Whether in religious ceremonies or daily meals, rice remains a vital component of global cuisine and heritage.

Editor’s Choice
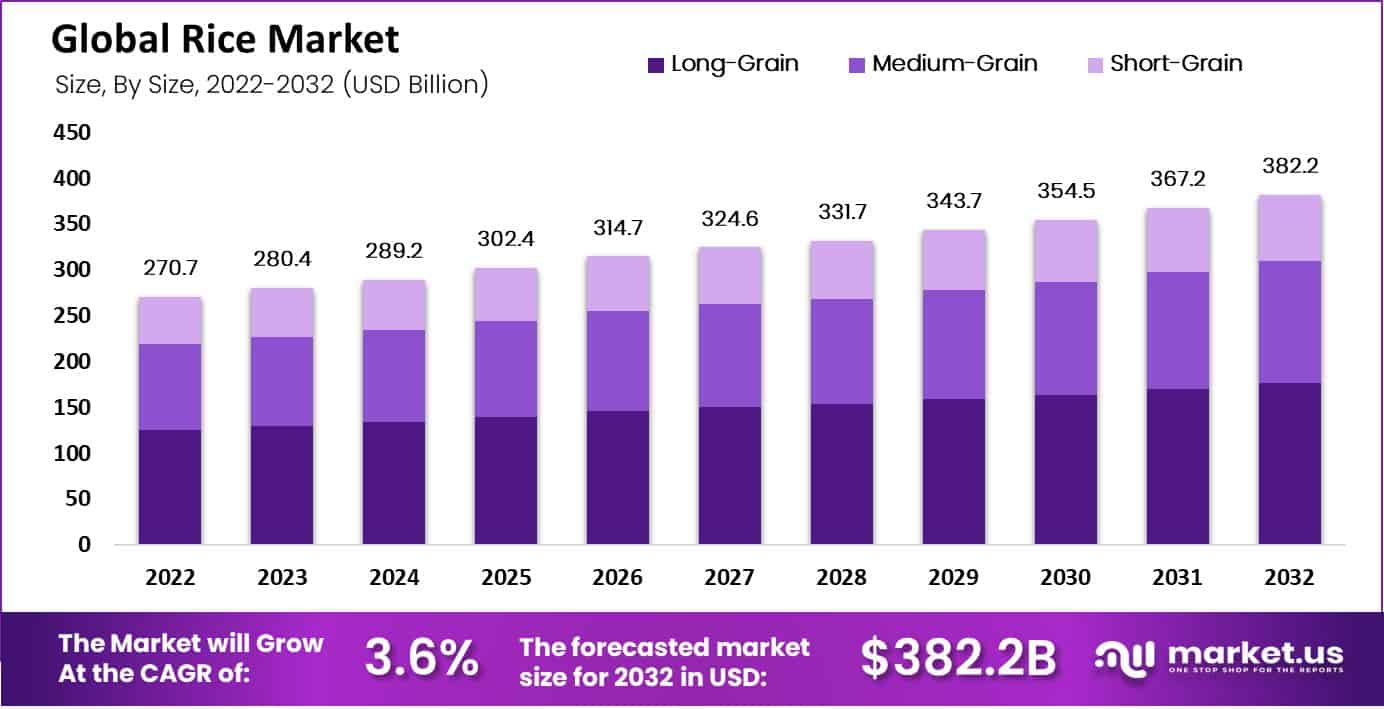
- The global rice market revenue reached USD 280.4 billion in 2023.
- This robust growth persisted through to 2032, culminating in a total market size of USD 382.2 billion, with long-grain rice commanding USD 176.6 billion, medium-grain contributing USD 132.6 billion, and short-grain reaching USD 73.0 billion.
- The distribution channels for the market are predominantly dominated by offline sales, which hold an 81% market share.
- From 2022 to 2023, the global rice supply reached 717.84 million metric tons.
- In 2022, the global landscape of rice production (paddy rice) was led by China, which topped the list with a substantial output of 208.49 million metric tonnes.
- India led the market with exports valued at US$10.8 billion, accounting for 36.8% of total rice exports worldwide.
Rice Market Overview
Global Rice Market Size Statistics
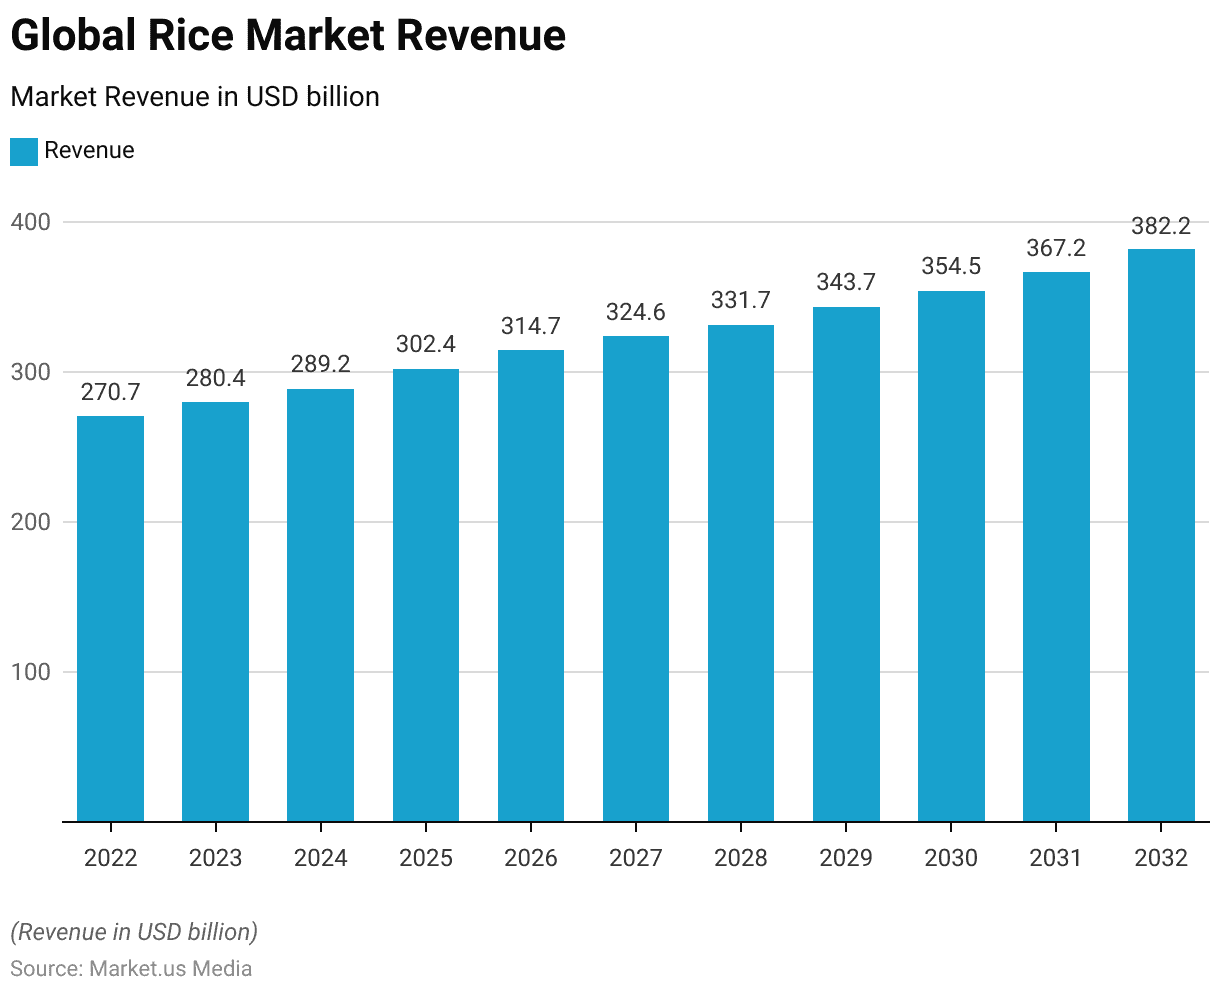
- The global rice market has shown a consistent upward trajectory in revenue from 2022 to 2032, a CAGR of 3.6%.
- Starting with a market size of USD 270.7 billion in 2022, the revenue increased to USD 280.4 billion in 2023, demonstrating moderate growth.
- The trend continues with an estimated revenue of USD 289.2 billion in 2024, and a more significant rise is anticipated in subsequent years. By 2025, the market is expected to reach USD 302.4 billion.
- This growth pattern is sustained over the following years, with market revenues projected to be USD 314.7 billion in 2026 and USD 324.6 billion in 2027.
- The revenue is forecasted to grow to USD 331.7 billion in 2028, followed by a more substantial increase to USD 343.7 billion in 2029.
- The upward trend persists into the next decade, with projected revenues of USD 354.5 billion in 2030, USD 367.2 billion in 2031, and finally, reaching USD 382.2 billion by 2032.
- This consistent increase underscores the robustness and expanding scale of the global rice market over the decade.
(Source: Market.us)

Global Rice Market Size – By Size Statistics
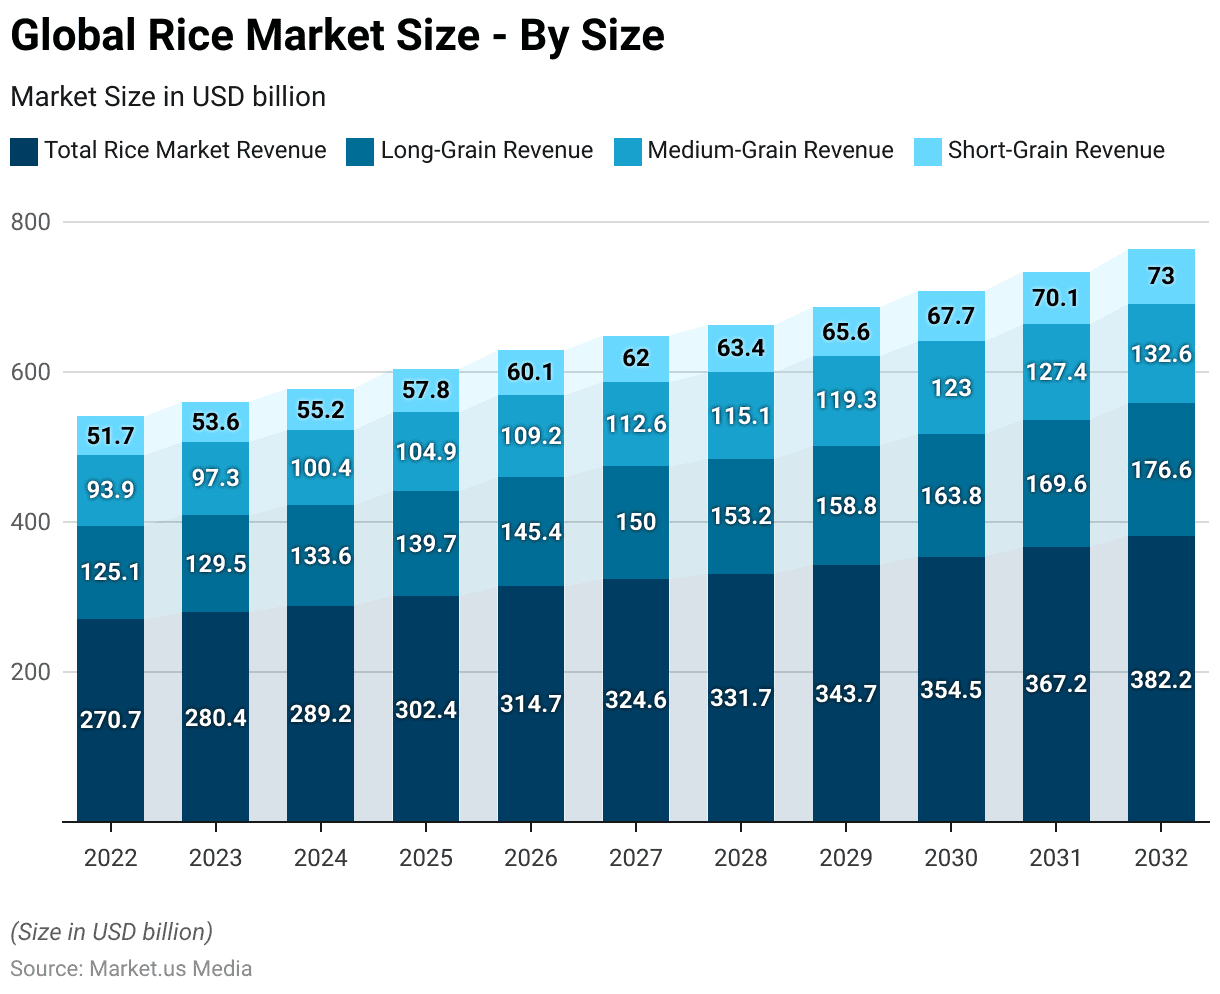
- The global rice market, segmented by grain size, has exhibited consistent growth from 2022 to 2032 across all categories. Starting in 2022, the total market revenue was USD 270.7 billion, split among long-grain rice at USD 125.1 billion, medium-grain rice at USD 93.9 billion, and short-grain rice at USD 51.7 billion.
- The following year, the total revenue increased to USD 280.4 billion, with long-grain rice generating USD 129.5 billion, medium-grain rice USD 97.3 billion, and short-grain rice USD 53.6 billion.
- This upward trend continued in 2024, with the market expanding to USD 289.2 billion overall, including USD 133.6 billion from long-grain, USD 100.4 billion from medium-grain, and USD 55.2 billion from short-grain.
- By 2025, total market revenue reached USD 302.4 billion, driven by USD 139.7 billion from long-grain, USD 104.9 billion from medium-grain, and USD 57.8 billion from short-grain.
- The market kept flourishing, climbing to USD 314.7 billion in 2026 and USD 324.6 billion in 2027, with contributions from long-grain rising to USD 150.0 billion and medium and short-grain also seeing increases in 2027.
- The market grew slightly to USD 331.7 billion in 2028, with long-grain rice at USD 153.2 billion, medium-grain at USD 115.1 billion, and short-grain at USD 63.4 billion.
- This robust growth persisted through to 2032, culminating in a total market size of USD 382.2 billion, with long-grain rice commanding USD 176.6 billion, medium-grain contributing USD 132.6 billion, and short-grain reaching USD 73.0 billion. This decade-long rise underscores the strong and expanding global demand for rice across all grain types.
(Source: Market.us)
Global Rice Market Share – By Distribution Channel Statistics
- The distribution channels for the market are predominantly dominated by offline sales, which hold an 81% market share. This substantial portion highlights the continued preference for traditional purchasing methods among consumers.
- Conversely, online sales account for 19% of the market. This indicates a significant, though smaller, reliance on digital platforms for purchasing, reflecting the ongoing integration of e-commerce into consumer buying habits.
- The distribution split underscores the current market dynamics where traditional methods still prevail, but online channels are gradually gaining traction.
(Source: Market.us)


Nutritional Composition of Rice
- White, long-grain rice, when cooked, provides a nutritional profile for a 100-gram serving as follows:
- It contains 130 calories and has minimal fat, with only 0.3 grams of total fat and 0.1 grams of saturated fat, both contributing 0% to the Daily Value.
- It has no cholesterol and a negligible sodium content of 1 milligram.
- This type of rice offers 35 milligrams of potassium, accounting for about 1% of the Daily Value.
- It is primarily composed of carbohydrates, providing 28 grams, which includes 0.4 grams of dietary fiber and a trace amount of sugar at 0.1 grams.
- The protein content stands at 2.7 grams, making up about 5% of the Daily Value.
- In terms of micronutrients, it provides 1% of the Daily Value for calcium and iron each, 5% for Vitamin B6, and 3% for magnesium. Still, it lacks Vitamin C, Vitamin D, and Cobalamin (Vitamin B12), all showing 0%.
- These percentages are based on a 2,000-calorie daily diet, which helps gauge the nutritional contribution of this food to an average diet.
(Source: U.S Department of Agriculture)
Total Global Supply of Rice
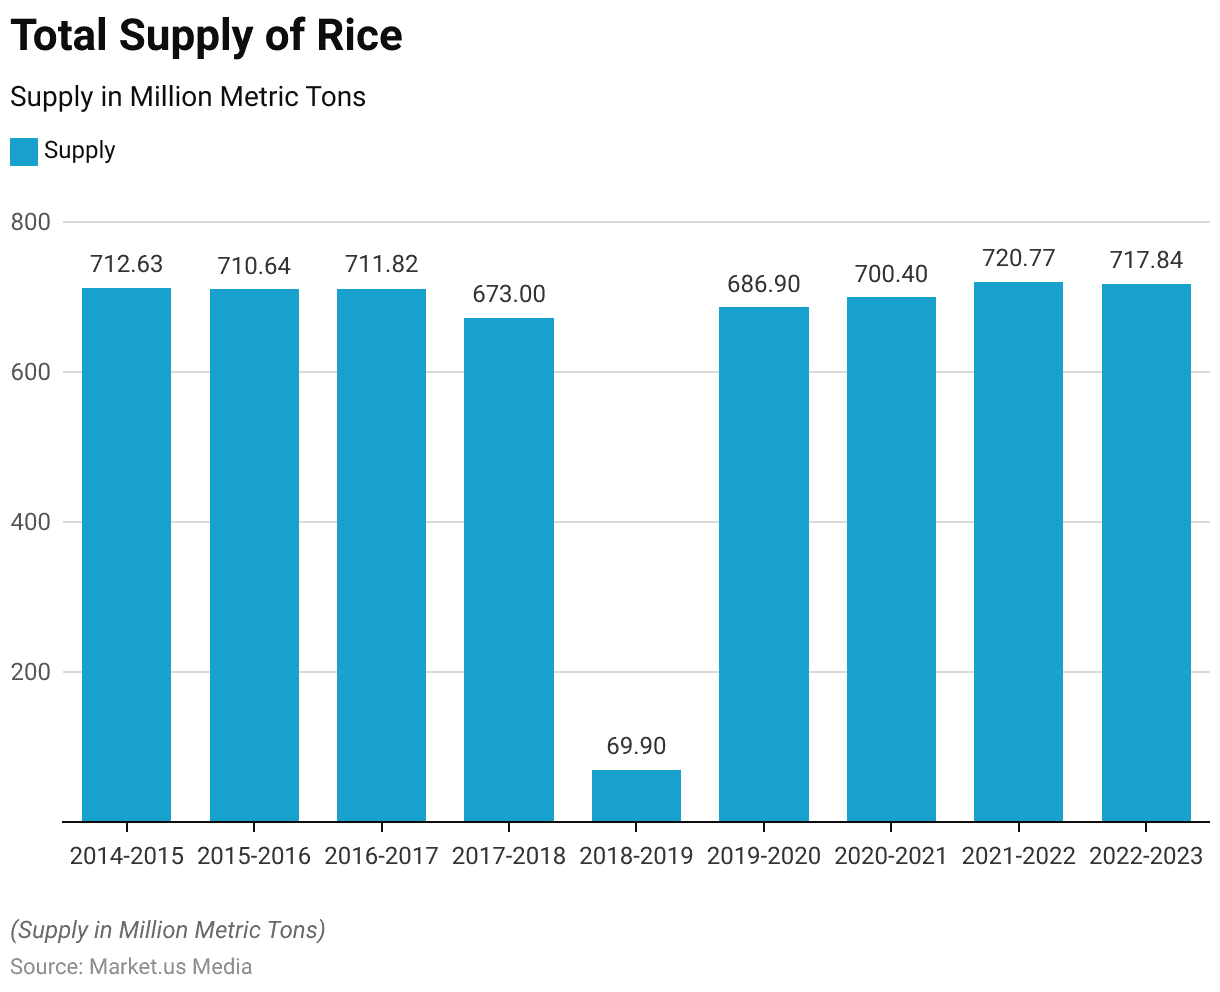
- The total global supply of rice, measured in million metric tons, fluctuated over the years from 2014 to 2023.
- Beginning at 712.63 million metric tons in the 2014-2015 marketing year, the supply dipped slightly to 710.64 million metric tons in 2015-2016 before recovering to 711.82 million metric tons in 2016-2017. However, a notable decrease occurred in 2017-2018, with the supply dropping to 673.00 million metric tons, possibly due to various factors such as weather-related disruptions, changes in agricultural practices, or market dynamics.
- This downward trend continued into the following year, with supply plummeting to 69.90 million metric tons in 2018-2019, indicating a significant decline.
- However, there was a rebound in 2019-2020, as the supply increased to 686.90 million metric tons, suggesting a partial recovery from the previous year’s low.
- Subsequent years showed further improvement, with supply reaching 700.40 million metric tons in 2020-2021 and 720.77 million metric tons in 2021-2022, reflecting a positive trajectory.
- However, in 2022-2023, the supply experienced a slight decline to 717.84 million metric tons.
- These fluctuations in global rice supply over the specified period may stem from a combination of factors such as changes in production levels, trade patterns, consumption trends, and external market influences, highlighting the dynamic nature of the global rice market.
(Source: Statista)

Global Rice Production Statistics
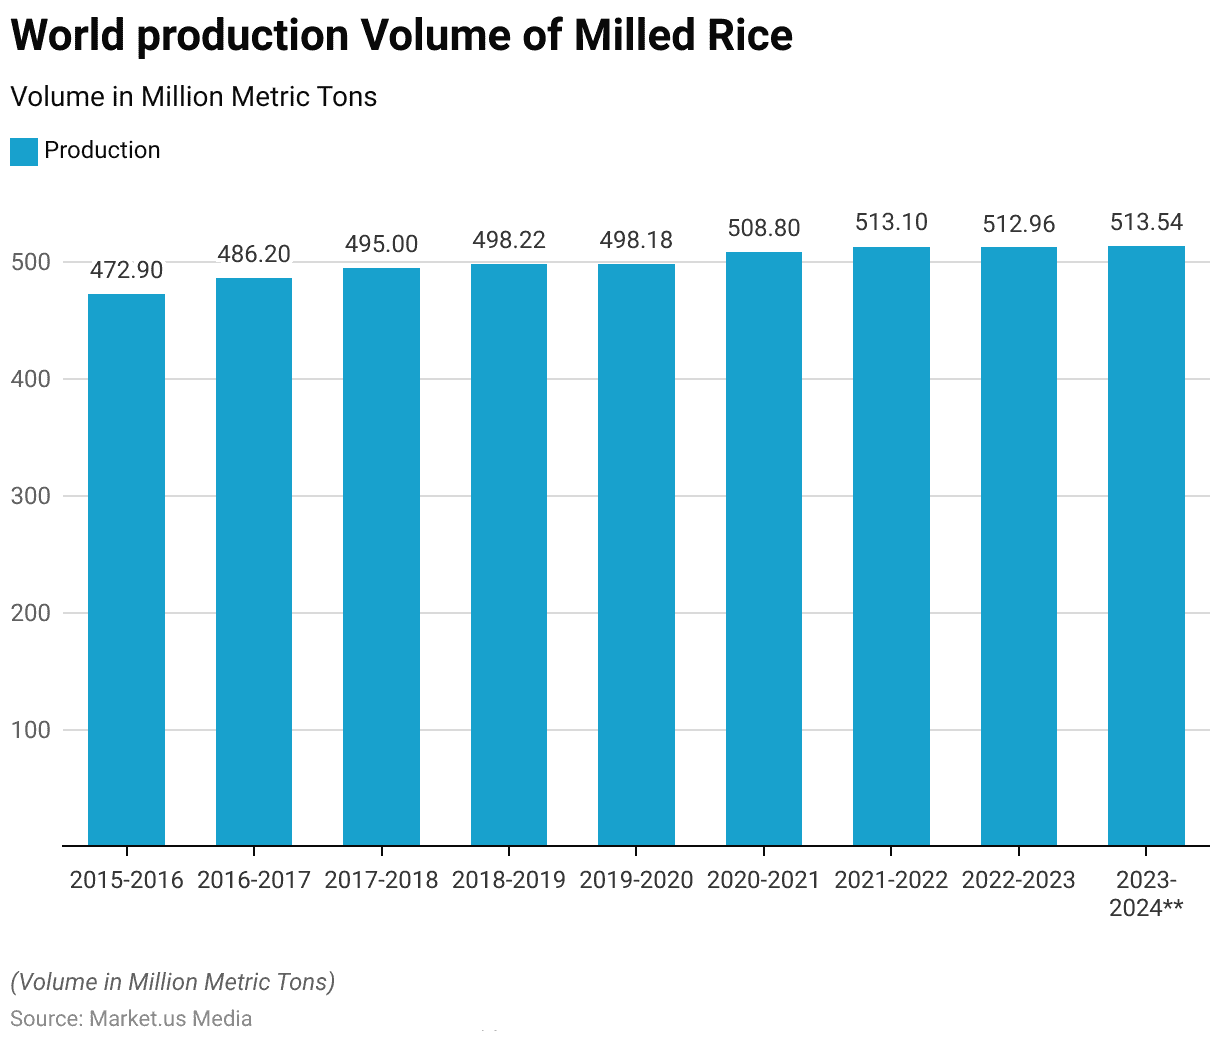
World Production Volume of Milled Rice
- The world production volume of milled rice has shown a generally upward trend, as depicted by the data.
- Starting at 472.90 million metric tons in 2015-2016, production increased steadily to 486.20 million metric tons in 2016-2017 and further to 495.00 million metric tons in 2017-2018.
- The trend continued with slight fluctuations, reaching 498.22 million metric tons in 2018-2019 and 498.18 million metric tons in 2019-2020.
- A more notable increase was observed in 2020-2021, with production rising to 508.80 million metric tons, followed by a moderate increase to 513.10 million metric tons in 2021-2022.
- However, the subsequent years showed a slight decline, with production remaining relatively stable at 512.96 million metric tons in 2022-2023 and slightly edging up to 513.54 million metric tons in 2023-2024.
- Overall, these figures suggest a consistent growth trajectory in global milled rice production over the specified period, albeit with some minor fluctuations in recent years.
- Factors such as changes in agricultural practices, technological advancements, climate conditions, and market demand likely contribute to these variations in production volumes.
(Source: Statista)

Top Countries With The Largest Production of Rice
- In 2022, the global landscape of rice production (paddy rice) was led by China, which topped the list with a substantial output of 208.49 million metric tonnes.
- India followed closely as the second-largest producer, yielding 196.25 million metric tonnes.
- Bangladesh secured the third position with a production of 57.19 million metric tonnes, while
- Indonesia and Vietnam ranked fourth and fifth, producing 54.75 million metric tonnes and 42.67 million metric tonnes, respectively.
- Thailand came in sixth with 34.32 million metric tonnes, followed by Myanmar with 24.68 million metric tonnes.
- The Philippines, Cambodia, and Pakistan rounded out the top ten, producing 19.78 million metric tonnes, 11.62 million metric tonnes, and 10.98 million metric tonnes, respectively.
- These figures highlight the significant contributions of these countries to the global rice supply.
(Source: FAOSTAT)


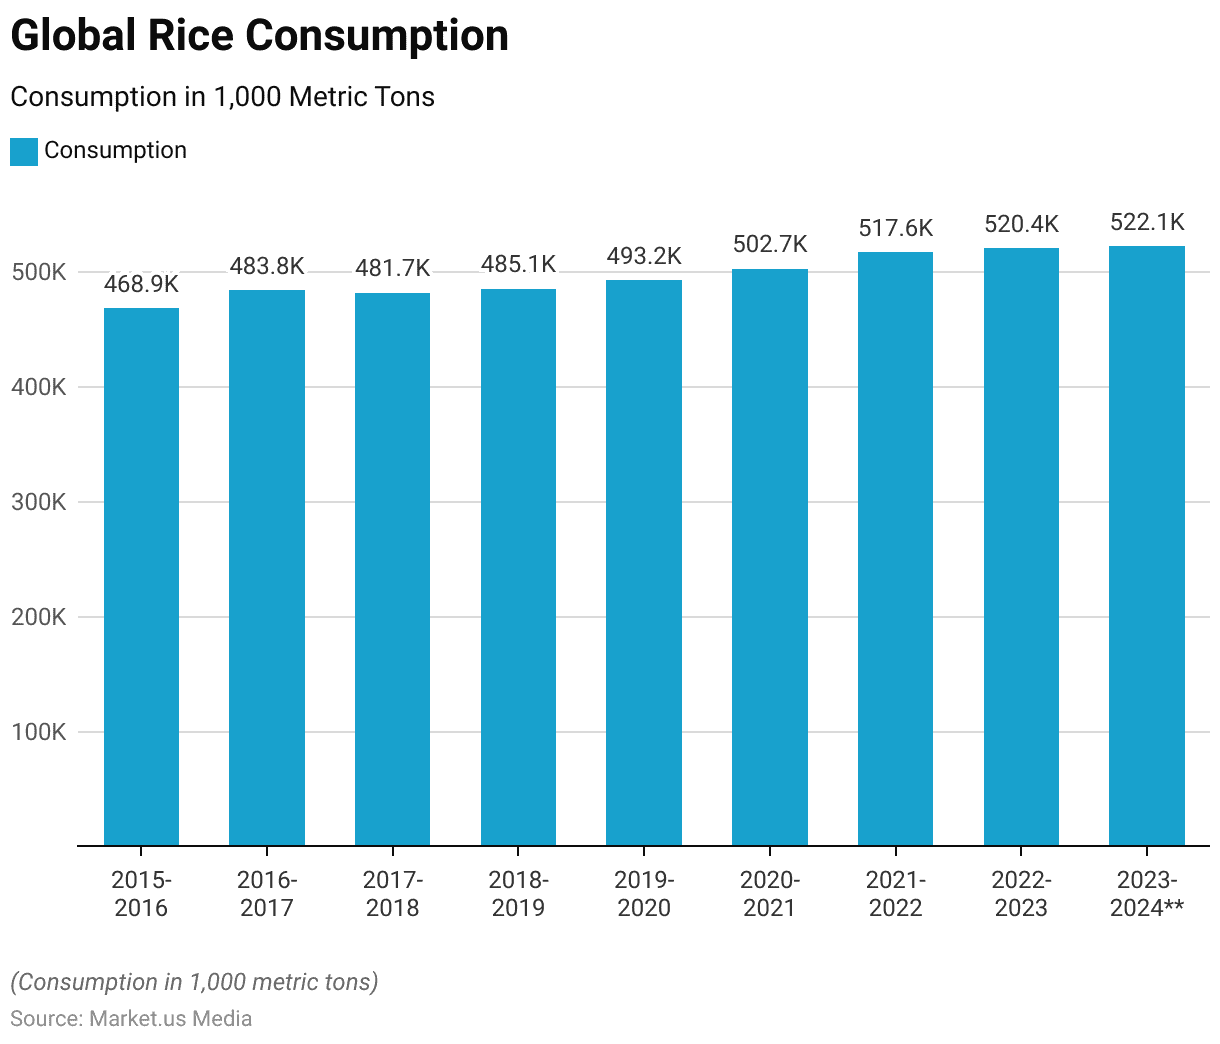
Global Rice Consumption
- Global rice consumption has seen a steady increase over the years from 2015 to 2024.
- The consumption started at 468,862 thousand metric tons in the 2015-2016 period.
- It rose to 483,817 thousand metric tons in 2016-2017, and though there was a slight decline to 481,678 thousand metric tons in 2017-2018, it rebounded to 485,064 thousand metric tons in 2018-2019.
- The upward trend continued into 2019-2020, with consumption reaching 493,232 thousand metric tons.
- In the 2020-2021 period, consumption exceeded half a million metric tons, recording a significant rise to 502,692 thousand metric tons.
- This growth persisted into the 2021-2022 period, with consumption surging to 517,622 thousand metric tons.
- The most recent data shows a further increase to 520,437 thousand metric tons in 2022-2023, with projections for 2023-2024 indicating a slight rise to 522,100 thousand metric tons.
- This trend underscores a consistent growth in global rice demand over the specified period.
(Source: Statista)

Global Rice Trade Statistics
Top 10 Rice Exporting Countries Statistics
- In 2022, the top rice-exporting countries demonstrated a diverse range of contributions to global rice trade.
- India led the market with exports valued at US$10.8 billion, accounting for 36.8% of total rice exports worldwide.
- Thailand followed as a significant exporter, generating $4 billion and capturing 13.5% of the market share.
- Vietnam also played a key role, with exports worth $2.5 billion, representing 8.6% of the market.
- Close behind, Pakistan exported rice valued at $2.4 billion, comprising 8% of the global share.
- The United States contributed $1.7 billion in rice exports, holding 5.8% of the market.
- China’s exports amounted to $1 billion, making up 3.5% of the total.
- Italy and Myanmar were relatively close in their export values at $804.7 million and $786.8 million, respectively, each claiming about 2.7% of the market.
- Brazil and Belgium rounded out the top ten, with Brazil exporting $657.5 million worth of rice (2.2% of the market) and Belgium $515.6 million (1.8%).
- These figures underscore the dominance and strategic importance of these countries in the global rice export market.
(Source: World’s Top Exports)

Countries Generating Highest Surpluses Trading Rice Statistics
- In 2022, several countries achieved notable trade surpluses in the rice market, each reflecting varying trends since 2021.
- India topped the list with a net export surplus of US$10.8 billion, an increase of 11.8% over the previous year.
- Thailand followed with a surplus of $4 billion, marking an 18.3% rise. Vietnam and Pakistan each reported a surplus of $2.3 billion, with growths of 1.1% and 9.2% respectively.
- Myanmar also saw a significant increase, with its surplus reaching $786.6 million, up 17.4%. Uruguay, with a 30.4% surge, recorded a surplus of $497.3 million.
- However, not all countries saw positive changes; Italy experienced a decrease of 15.4% in its surplus, bringing it down to $451.3 million. Cambodia’s surplus slightly declined by 1.3% to $412.5 million.
- Brazil showed a dramatic improvement, with its surplus soaring by 626.7% to $307.4 million.
- Conversely, the United States faced a steep decline, with its surplus dropping by 67.3% to just $298.1 million.
- These figures illustrate a dynamic global rice trade environment with varying degrees of growth and contraction among the leading exporting countries.
(Source: World’s Top Exports)
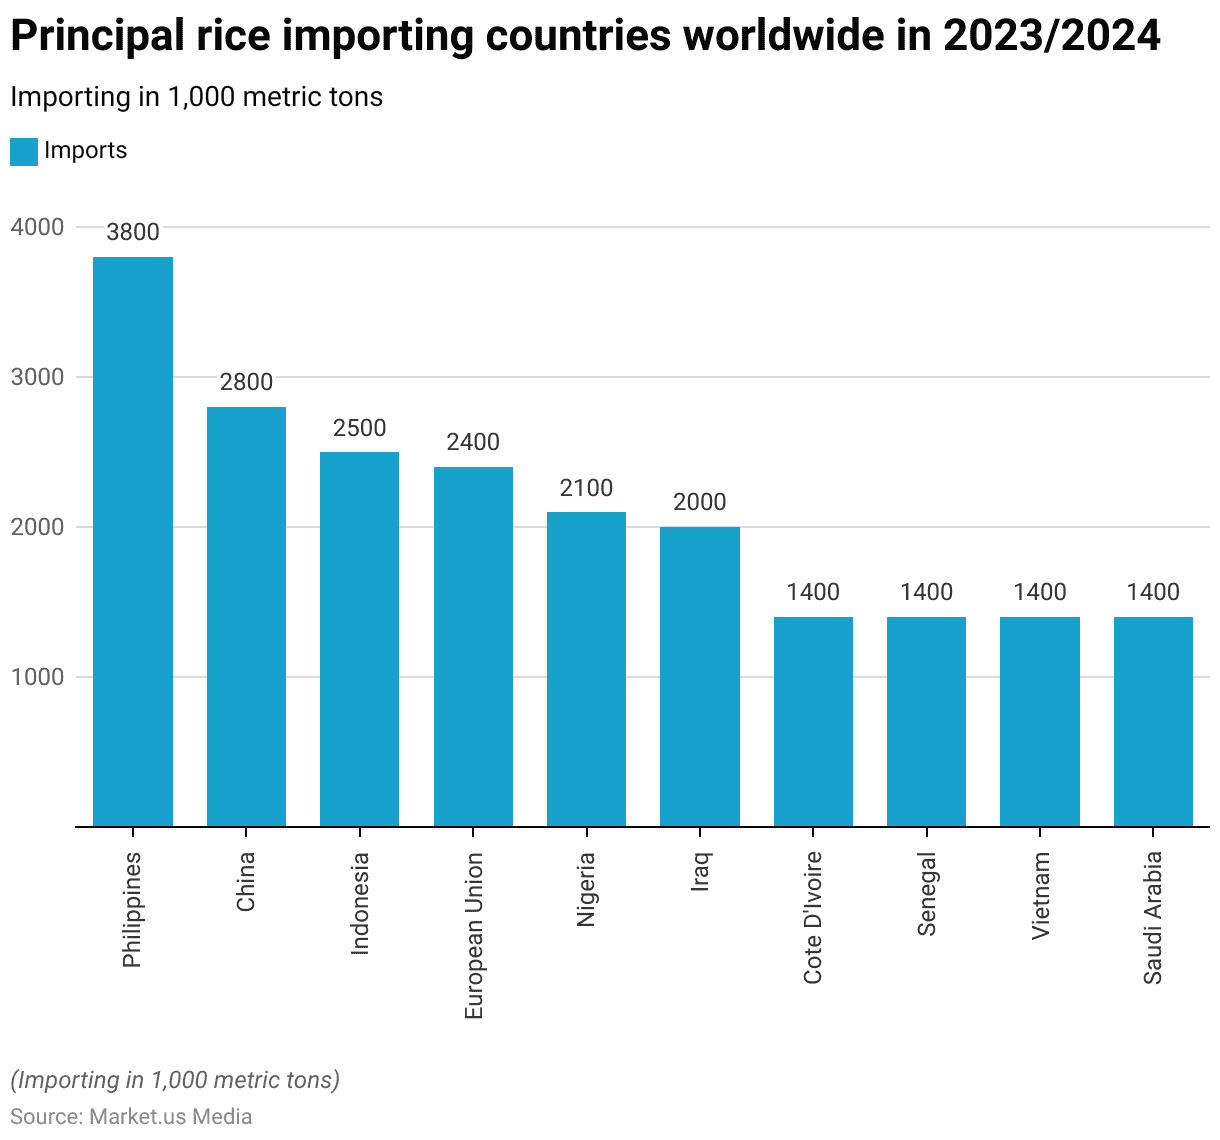
Top 10 Rice Importing Countries Statistics
- In the 2023/2024 period, several countries emerged as principal rice importers, reflecting diverse global demand.
- The Philippines led the rankings with rice imports totaling 3.8 million metric tonnes, followed by China with 2.8 million metric tonnes and Indonesia with 2.5 million metric tonnes.
- Notably, the European Union, acting as a collective entity, imported 2.4 million metric tonnes of rice.
- Nigeria and Iraq each imported 2.1 million metric tonnes, while Cote D’Ivoire, Senegal, Vietnam, and Saudi Arabia imported 1.4 million metric tonnes each.
- This data underscores the significant role these countries play in the international rice trade, as well as the widespread consumption of rice across various regions globally.
(Source: Statista)

HS Code for Rice
- The Harmonized System (HS) provides a standardized classification system for goods traded internationally, assigning unique codes to various products for customs and tariff purposes.
- In the case of rice, different types and processing methods are distinguished by specific HS codes. Unhusked rice, also known as paddy rice, is classified under HS code 1006.10.
- Husked rice, which has had its outer hull removed, is identified by HS code 1006.20.
- Parboiled rice, a type of rice that has been partially boiled in the husk before milling, is designated by HS code 1006.30.
- Semi-milled rice, which undergoes partial milling to remove the husk and some bran layers, has the HS code 1006.40.
- Furthermore, within the category of parboiled rice, specific varieties such as Basmati rice are further distinguished. Basmati rice, known for its long grains and aromatic qualities, is assigned the HS code 10063020.
- These HS codes facilitate the accurate classification and tracking of rice shipments in international trade, aiding customs authorities, importers, and exporters in the proper identification and valuation of goods.
(Source: TradeImeX)
Price of Rice Around the Globe
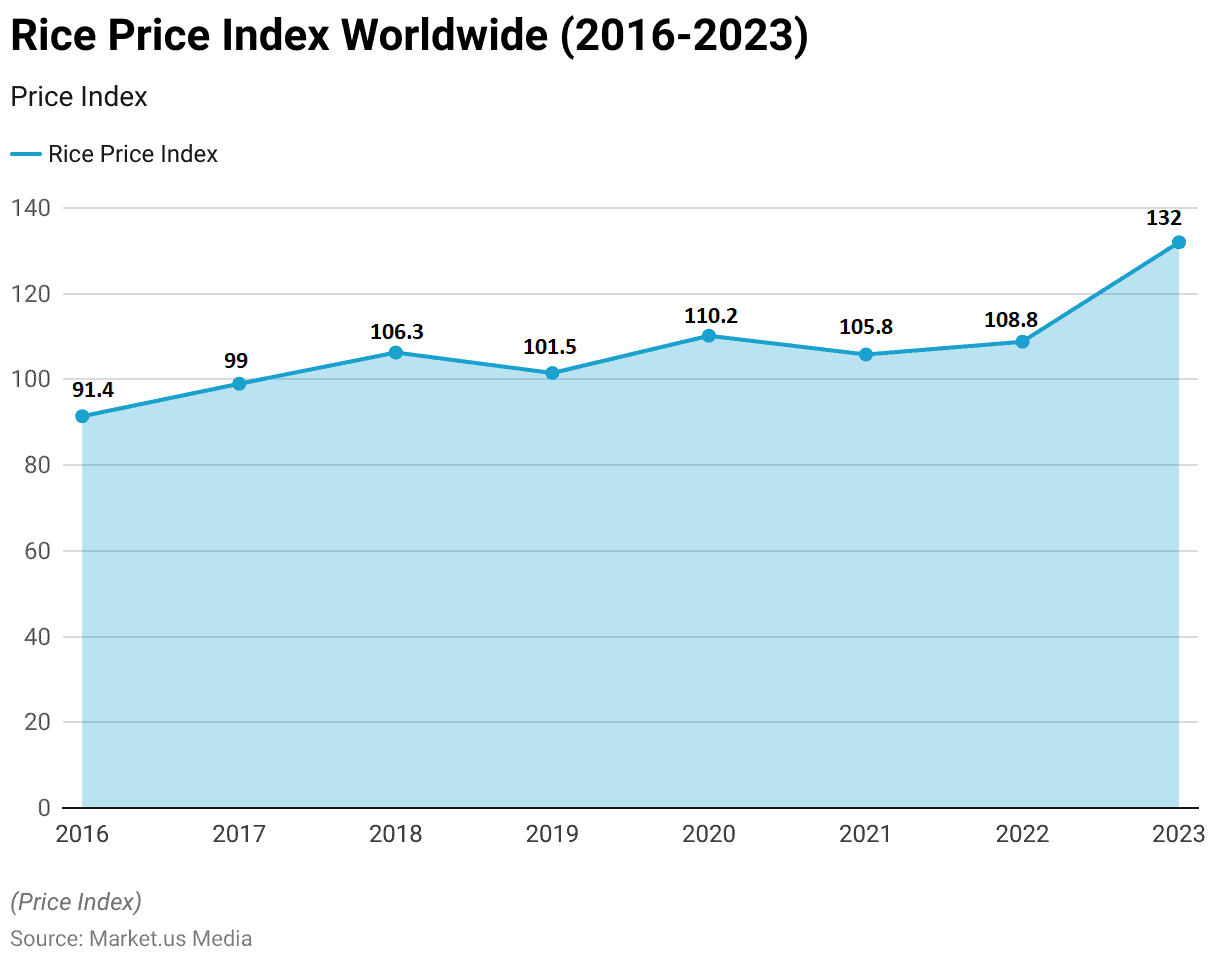
Rice Price Indices Worldwide Statistics
- The worldwide rice price indices from 2016 to 2023 depict fluctuations in the global rice market over this period.
- Starting at 91.4 in 2016, the index climbed steadily to 99 in 2017 and further to 106.3 in 2018, indicating a rising trend in rice prices.
- However, in 2019, the index experienced a slight dip to 101.5 before rebounding strongly to 110.2 in 2020, marking a significant increase.
- The following year, 2021, saw a modest decline to 105.8, suggesting some stabilization in prices.
- Notably, 2022 witnessed a slight uptick in the index, reaching 108.8, indicating a moderate rise.
- However, the most notable shift occurred in 2023, with the index soaring to 132, signifying a substantial spike in rice prices.
- These fluctuations likely reflect various factors such as weather conditions, supply and demand dynamics, geopolitical tensions, and economic policies, all of which influence the global rice market and ultimately impact rice prices worldwide.
(Source: Statista)

Price Rankings of Rice – By Country Statistics
- The price rankings for white rice per kilogram vary across countries, reflecting a range of factors, including production costs, import tariffs, and market demand.
- In the United States, white rice is priced at USD 4.58 per kilogram, indicating relatively higher costs compared to other nations.
- Canada follows closely with a price of USD 3.68 per kilogram, while Japan and Sweden stand at USD 3.38 and USD 3.30 per kilogram, respectively.
- Switzerland and South Korea exhibit similar pricing, with rates of USD 3.14 and USD 3.09 per kilogram, respectively.
- The Netherlands and Taiwan are also within this range, with prices at USD 3.08 and USD 3.00 per kilogram, respectively.
- Germany offers white rice at USD 2.93 per kilogram, while Malta’s pricing is slightly lower at USD 2.89 per kilogram.
- These variations in pricing reflect the interplay of factors such as economic conditions, trade agreements, and consumer preferences, shaping the cost of white rice in different global markets.
(Source: Numbeo)

Consumer Preferences
Frequency of Rice Purchased by Households Statistics
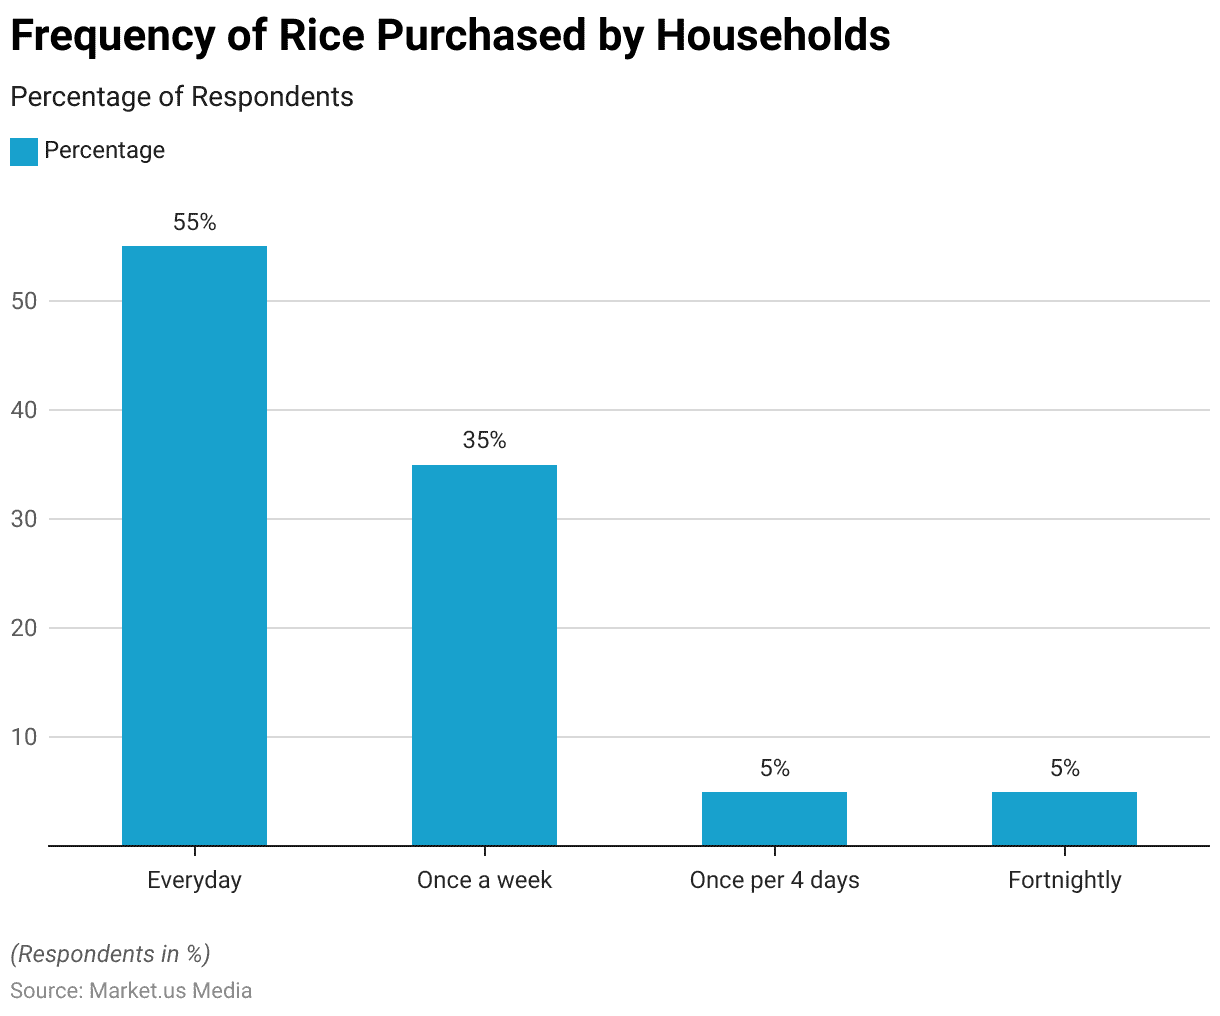
- Consumer preferences regarding the frequency of rice purchases by households reveal distinct patterns in consumption habits.
- According to survey data, a majority of respondents, accounting for 55%, indicated that they purchase rice every day, indicating a high frequency of consumption. This suggests that rice holds a central and staple position in the diets of these households, likely reflecting cultural norms and dietary preferences.
- Additionally, 35% of respondents reported purchasing rice once a week, indicating a slightly lower but still significant frequency of consumption among this group.
- Another 5% of respondents stated that they purchase rice once every four days, suggesting a more frequent consumption pattern compared to weekly buyers.
- Similarly, another 5% of respondents reported purchasing rice fortnightly, indicating a less frequent but still notable consumption frequency.
- These findings underscore the widespread and regular consumption of rice across different households, with variations in purchasing frequency reflecting diverse dietary habits, lifestyle choices, and cultural influences.
(Source: OpenJiCareReport)

Consumer Preferences on Imported and Locally Grown Rice Statistics
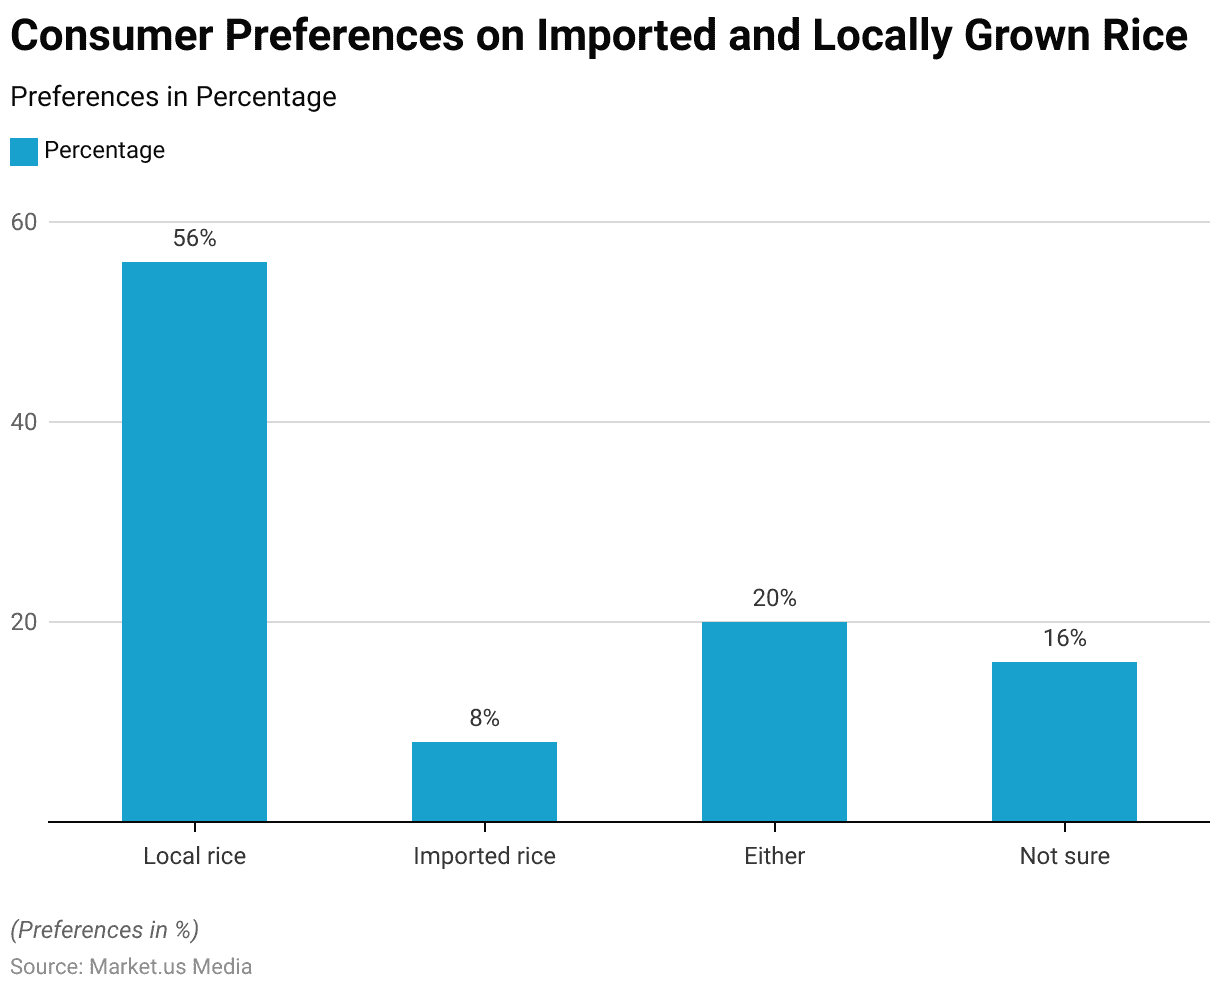
- Consumer preferences regarding imported and locally grown rice reveal nuanced patterns in purchasing behavior and perceptions.
- According to survey data, a majority of respondents, comprising 56%, expressed a preference for locally grown rice. This preference likely stems from factors such as perceived freshness, support for local farmers, and cultural attachment to traditional varieties.
- In contrast, only 8% of respondents indicated a preference for imported rice, suggesting a relatively lower demand for rice sourced from other countries.
- However, a significant portion of respondents, representing 20%, stated that they were open to purchasing either locally grown or imported rice, indicating a level of flexibility and willingness to consider various options based on factors such as availability, price, and quality.
- Additionally, 16% of respondents expressed uncertainty about their preference, indicating a lack of strong inclination towards either option or perhaps insufficient awareness about the differences between locally grown and imported rice.
- These findings underscore the importance of understanding consumer attitudes and perceptions towards rice sourcing, which can inform marketing strategies, product positioning, and efforts to promote local agriculture.
(Source: OpenJiCareReport)

Reasons for Selection of Rice Statistics
- Households exhibit varied reasons for their selection of rice, as indicated by survey data. Taste emerged as the primary driver, with ten households emphasizing it as the decisive factor in their choice of rice, suggesting a strong emphasis on flavor preferences.
- Additionally, affordability played a significant role, with 16 households prioritizing low prices when selecting rice, highlighting the importance of economic considerations in purchasing decisions.
- Furthermore, factors related to rice characteristics and cooking attributes also influenced selection. For instance, six households considered the length of cooking time, indicating a preference for convenience and efficiency in meal preparation.
- Texture after cooking was another crucial factor, with four households preferring a soft texture and only one household prioritizing a hard texture.
- Moreover, aspects such as the size, length, and form of rice grains also factored into decision-making, albeit to a lesser extent, with five households considering size and four households considering the form of rice.
- These findings underscore the complexity of consumer preferences regarding rice, influenced by a combination of sensory experiences, practical considerations, and budget constraints.
(Source: OpenJiCareReport)


Recent Developments
Golden Rice Deployment in the Philippines:
- The introduction of Golden Rice, enriched with beta-carotene to address Vitamin A deficiency, has seen significant progress.
- The Philippine Rice Research Institute distributed free seeds in regions with high Vitamin A deficiency rates.
- The first large-scale harvest occurred in late 2022, producing over 100 tons of paddy from the new variety named Malusog Rice.
- This rice is being marketed alongside regular varieties, showing promise for both health impacts and market acceptance.
FAO Rice Market Monitoring:
- The Food and Agriculture Organization (FAO) continues to provide detailed analysis through its Rice Market Monitor, which covers global and national rice market trends.
- The monitor includes data on production, consumption, trade, and pricing, serving as a vital resource for stakeholders in the rice sector.
Rice Genetic Research:
- Advances in genetic research have identified several important quantitative trait loci (QTLs) that influence rice grain quality traits such as grain shape, size, and milling quality.
- Recent studies have pinpointed specific genes that impact these traits, enhancing the potential for breeding more efficient and higher-quality rice varieties.
Funding and Investments:
- Venture capital funding of $10 million was secured by DEF Rice Technologies to develop sustainable farming practices and implement precision agriculture techniques, aiming to increase crop yields by 25%.
- Strategic investment of $20 million by GHI Global Investors in a rice breeding research institute to accelerate the development of high-yield, disease-resistant rice varieties.
Technological Advancements:
- Adoption of blockchain technology in rice supply chains to enhance traceability and transparency, reducing the risk of counterfeit products and ensuring food safety standards.
- Implementation of AI-driven predictive analytics in rice farming practices to optimize irrigation schedules and pest control measures, leading to a 30% reduction in production costs.
Conclusion
Rice Statistics – In conclusion, rice remains a staple food worldwide, with its consumption deeply ingrained in various cultures and cuisines.
The global rice market has exhibited steady growth over the years, driven by factors such as population growth, changing dietary preferences, and economic development.
Diverse trends, including fluctuations in production, consumption, and trade patterns, characterize the market. Furthermore, consumer preferences for rice are influenced by a multitude of factors, including taste, texture, price, and cultural traditions.
Understanding these dynamics is essential for stakeholders in the rice industry, including producers, traders, and policymakers, to navigate the complexities of the market effectively.
As the world continues to evolve, the demand for rice is likely to remain robust, presenting opportunities for innovation, sustainability, and growth in the rice sector.
FAQs
Rice comes in various types, including long-grain, medium-grain, and short-grain. Additionally, there are specialty varieties such as Basmati, Jasmine, Arborio, and sushi rice.
Rice is typically grown in flooded fields called paddies. The process involves planting rice seeds in prepared soil, flooding the fields with water, nurturing the plants as they grow, and eventually harvesting the mature rice grains.
Rice is a rich source of carbohydrates, providing energy for the body. It also contains essential nutrients such as vitamins, minerals, and dietary fiber. The nutritional profile varies depending on the type of rice, with brown rice often being considered healthier due to its higher fiber and nutrient content compared to white rice.
Rice is a versatile ingredient used in countless dishes worldwide. Some popular examples include sushi from Japan, paella from Spain, biryani from India, risotto from Italy, and jollof rice from West Africa.
Rice processing involves several steps, including milling, husking, polishing, and sometimes parboiling or steaming, depending on the desired final product. The process removes the outer layers of the rice grain to produce polished white rice or leaves them intact to produce brown rice.
Discuss your needs with our analyst
Please share your requirements with more details so our analyst can check if they can solve your problem(s)