


Table of Contents
- Introduction
- Editor’s Choice
- Global Non-Alcoholic Beverages Market Overview
- Popular Beverage Brands
- Demographics of Non-Alcoholic Beverage Consumers Statistics
- Non-Alcoholic Beverage Sales Statistics
- Reasons for Choosing Non-Alcoholic Beverages Statistics
- Government Initiatives for Supporting Non-Alcoholic Beverages
- Recent Developments
- Conclusion
- FAQs
Introduction
Non-alcoholic Beverages Statistics: Non-alcoholic drinks encompass a diverse range of beverages devoid of alcohol, including soft drinks, water, fruit juices, health drinks, tea, coffee, and dairy-based options.
This market is notable and expanding due to the growing health awareness and shifts in consumer preferences.
Leading companies like Coca-Cola and PepsiCo hold sway in this industry, providing extensive offerings and engaging in competition through innovation and brand recognition.
Consumers’ increasing preference for healthier choices propels the demand for beverages containing natural ingredients and offering functional benefits. It is crucial to adhere to regulations to maintain the safety of products and foster trust among consumers.
Editor’s Choice
- The global non-alcoholic beverages market revenue will reach 2,135 billion in 2033.
- Among competitors, PepsiCo stands out with an impressive 18% market share, closely followed by Unilever at 15% and The Coca-Cola Company at 14%.
- The United States emerged as the frontrunner in 2022, boasting a commanding market revenue of USD 447.35 billion, underpinned by high consumer spending power, a vast population, and a strong culture of beverage consumption.
- Dole leads the pack with an impressive 76% popularity rating in beverages.
- According to NielsenIQ, the purchase of low and no-alcohol (LNA) beverages was reported in less than 5% of households, constituting 3.5% of the total alcohol market share.
- Millennials and Generation X exhibit a greater inclination towards non-alcoholic beverages due to their pursuit of healthier lifestyles, with 41% and 54%, respectively, citing this as a motivating factor.
- The World Health Organization (WHO) urges alcohol producers and retailers to prioritize no-alcohol and lower-alcohol products in their portfolios to reduce overall alcohol consumption.
Global Non-Alcoholic Beverages Market Overview
Global Non-Alcoholic Beverages Market Size Statistics
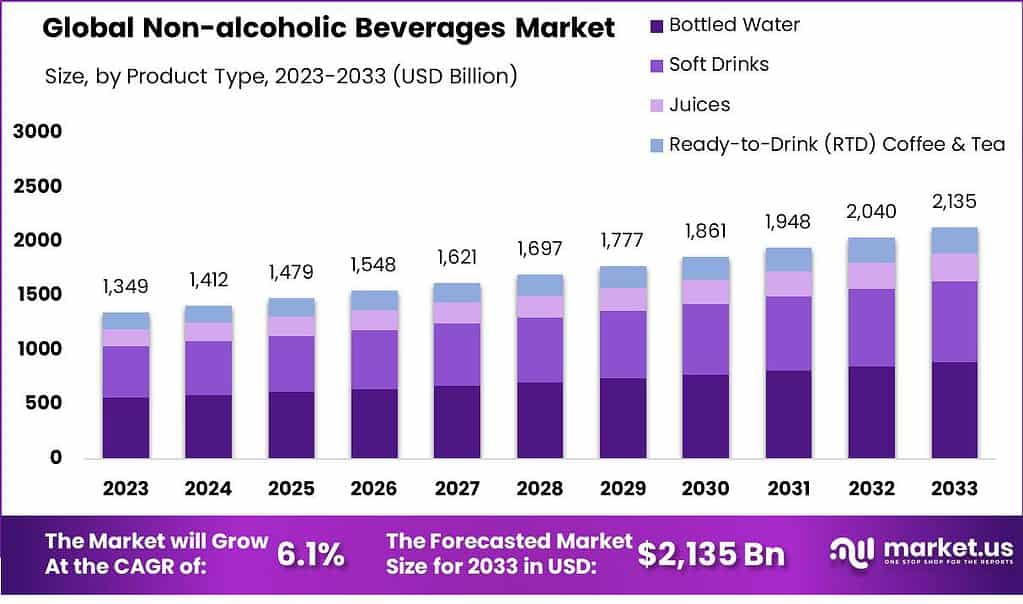
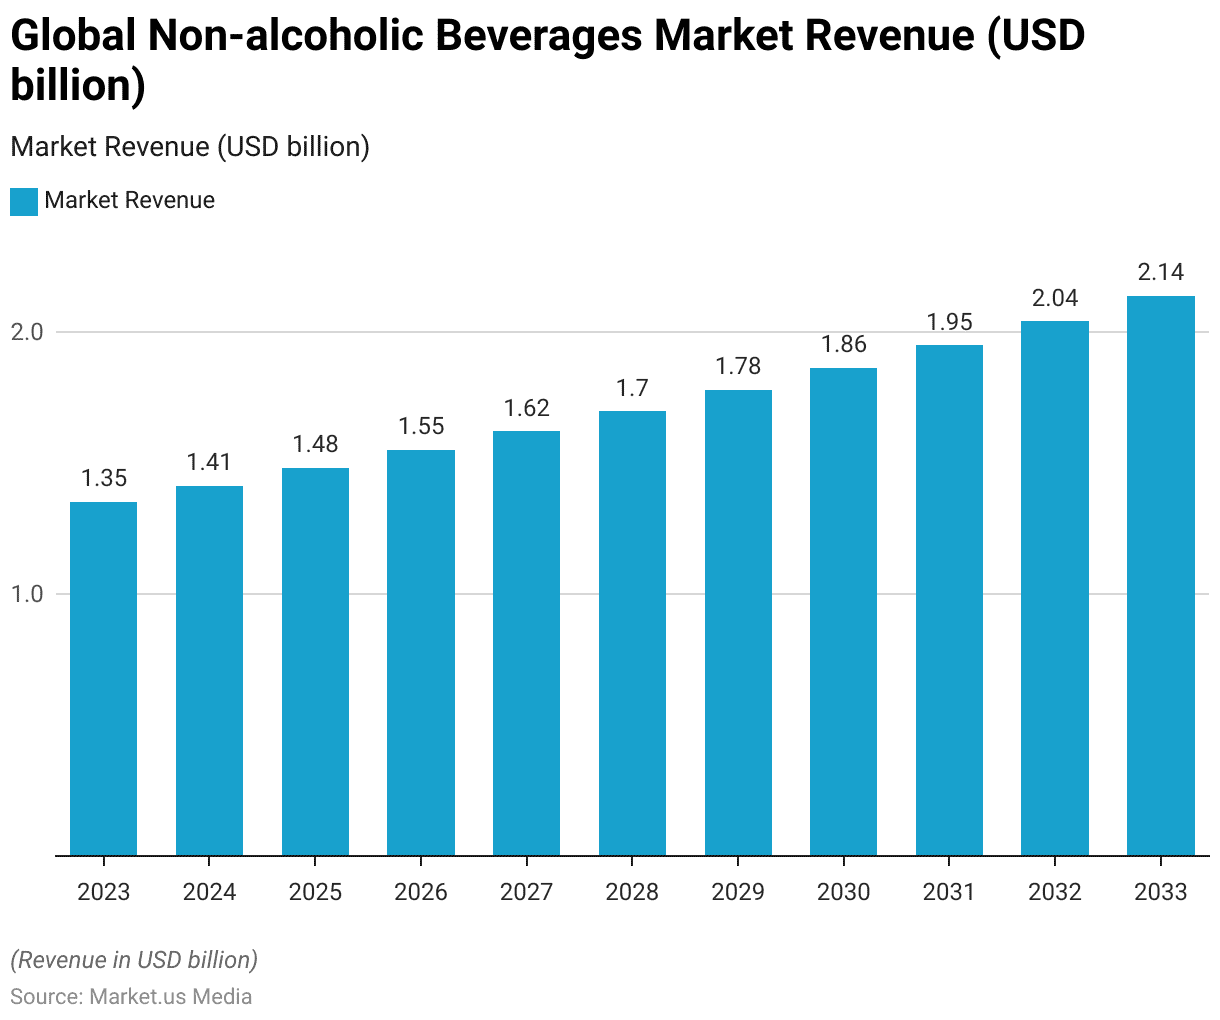
- The global non-alcoholic beverages market is exhibiting steady growth at a CAGR of 6.1%, with revenue reaching USD 1,349 billion in 2023 and showing a consistent upward trajectory over the forecast period.
- Projections indicate a continuous increase, with revenue expected to reach USD 1,412 billion in 2024, USD 1,479 billion in 2025, and USD 1,548 billion in 2026.
- This growth trend is anticipated to persist, with revenue forecasts of USD 1,621 billion in 2027, USD 1,697 billion in 2028, and USD 1,777 billion in 2029.
- By 2030, the market is anticipated to surpass USD 1,861 billion and continue to climb, reaching USD 1,948 billion in 2031 and USD 2,040 billion in 2032.
- Furthermore, the market revenue is forecasted to reach 2,135 billion in 2033.
- The trend reflects sustained consumer demand for non-alcoholic beverage products globally, underpinned by evolving consumer preferences, health consciousness, and innovative product offerings, driving market expansion.
(Source: Market.us)

Key Players in the Global Non-Alcoholic Beverages Market Statistics
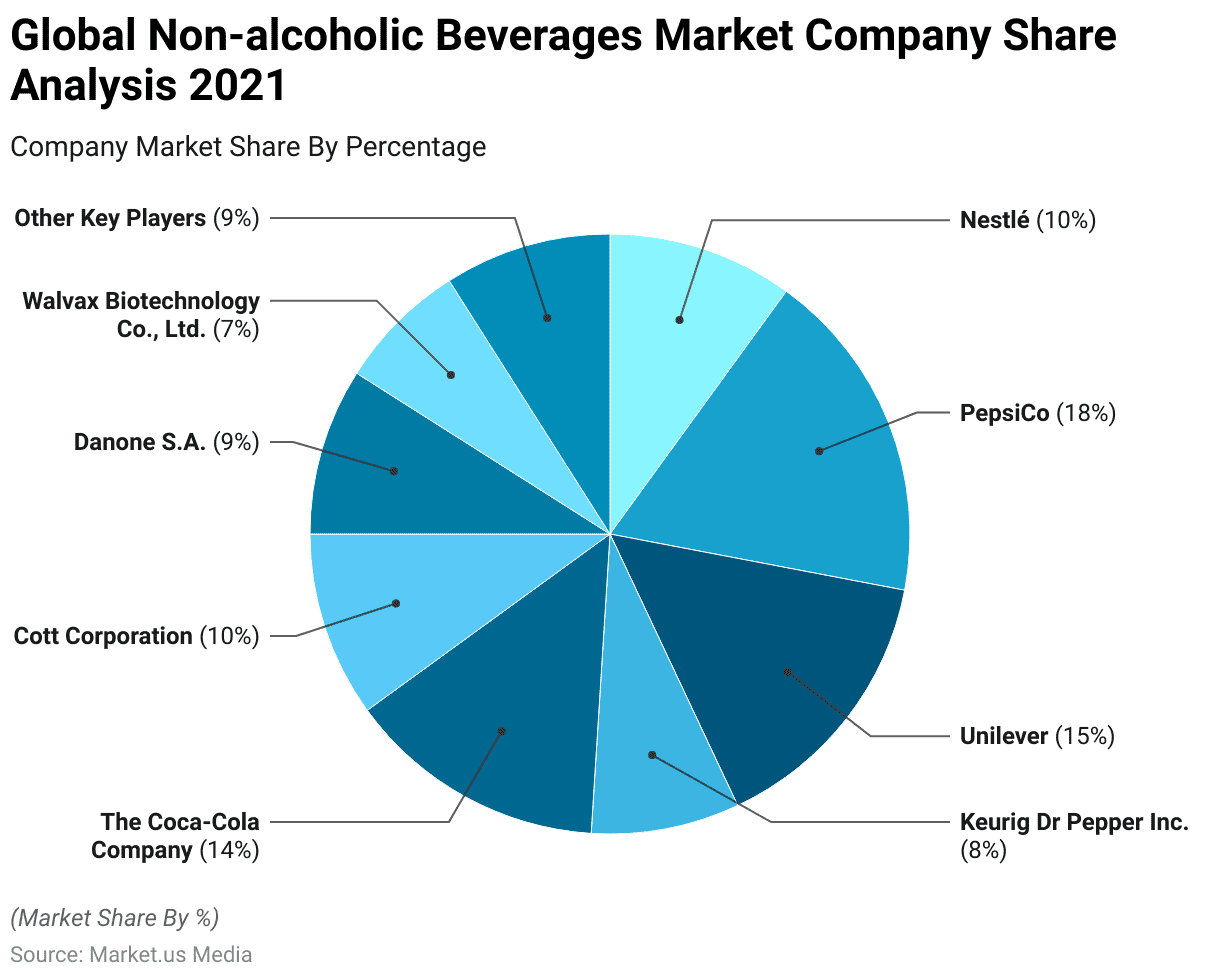
- The non-alcoholic beverages market is dominated by several key players, each vying for a significant share of consumer preference and market revenue.
- Among these competitors, PepsiCo stands out with an impressive 18% market share, followed by Unilever at 15% and The Coca-Cola Company at 14%.
- Nestlé and Cott Corporation each command a respectable 10% share, while Danone S.A. holds 9%.
- Keurig Dr. Pepper Inc. and Walvax Biotechnology Co., Ltd. contribute 8% and 7%, respectively.
- Other key players collectively hold a 9% share, indicative of a diverse and competitive landscape within the non-alcoholic beverages industry.
- These market shares reflect each company’s strategic positioning and brand strength, with ongoing efforts to innovate and meet evolving consumer preferences driving the dynamics of this vibrant sector.
(Source: Market.us)
Global Non-Alcoholic Beverages Market Revenue – By Country Statistics
- In 2022, the global non-alcoholic drinks market exhibited substantial revenue figures across various countries, reflecting diverse consumer preferences and economic landscapes.
- The United States emerged as the frontrunner, boasting a commanding market revenue of USD 447.35 billion, underpinned by high consumer spending power, a vast population, and a strong culture of beverage consumption.
- China, the world’s most populous nation, followed closely with a significant revenue of USD 135.86 billion, driven by rapid urbanization, increasing disposable incomes, and a growing health and wellness awareness.
- Japan and Germany, renowned for their advanced beverage industries and sophisticated consumer markets, contributed USD 68.63 billion and USD 53.77 billion, respectively, reflecting a blend of tradition and innovation in beverage consumption.
- The United Kingdom, Mexico, and Nigeria each surpassed the USD 30 billion mark, underscoring the global reach of non-alcoholic beverages and the emergence of diverse consumer preferences across different regions.
- Indonesia, France, and South Korea also played notable roles, with revenue figures ranging from USD 22.86 billion to USD 27.4 billion, indicating their significance in the global market landscape.
- Meanwhile, countries like Spain, Brazil, Australia, Canada, and India contributed between USD 15.96 billion and USD 20.75 billion, highlighting varying levels of market maturity and consumer demand.
- This diverse distribution of revenue underscores the importance for beverage companies to understand and adapt to the unique dynamics of each market to sustain growth and profitability on a global scale.
(Source: Statista)

Popular Beverage Brands
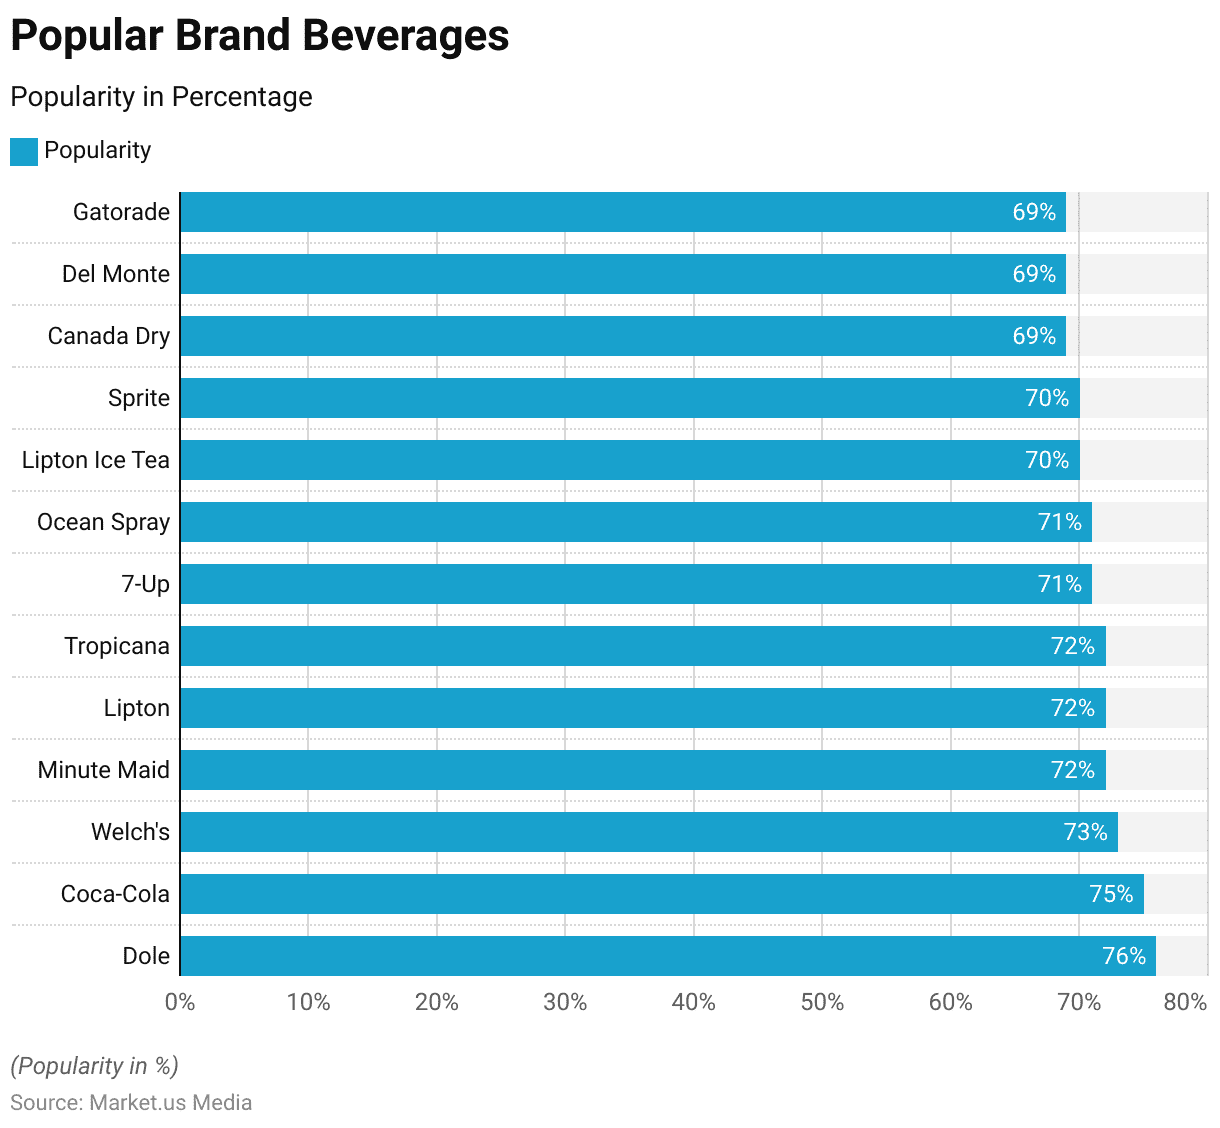
- Several brands stand out for their widespread popularity among consumers in beverages.
- Dole leads the pack with an impressive 76% popularity rating, closely followed by iconic names like Coca-Cola and Welch’s, each commanding a sizable share of consumer preference at 75% and 73%, respectively.
- Minute Maid, Lipton, and Tropicana share the spotlight with a popularity rating of 72%, highlighting the strong appeal of their products in the market.
- Other renowned brands, such as 7-Up, Ocean Spray, and Sprite, maintain a significant presence with popularity ratings of 71%.
- Lipton Ice Tea also enjoys considerable favourability with a 70% rating, alongside Canada Dry, Del Monte, and Gatorade, each garnering a respectable 69% popularity rating.
- This data underscores the diverse array of beverage choices available to consumers and the enduring appeal of these well-established brands in meeting their preferences and tastes.
(Source: YouGov)

Demographics of Non-Alcoholic Beverage Consumers Statistics
According to Age
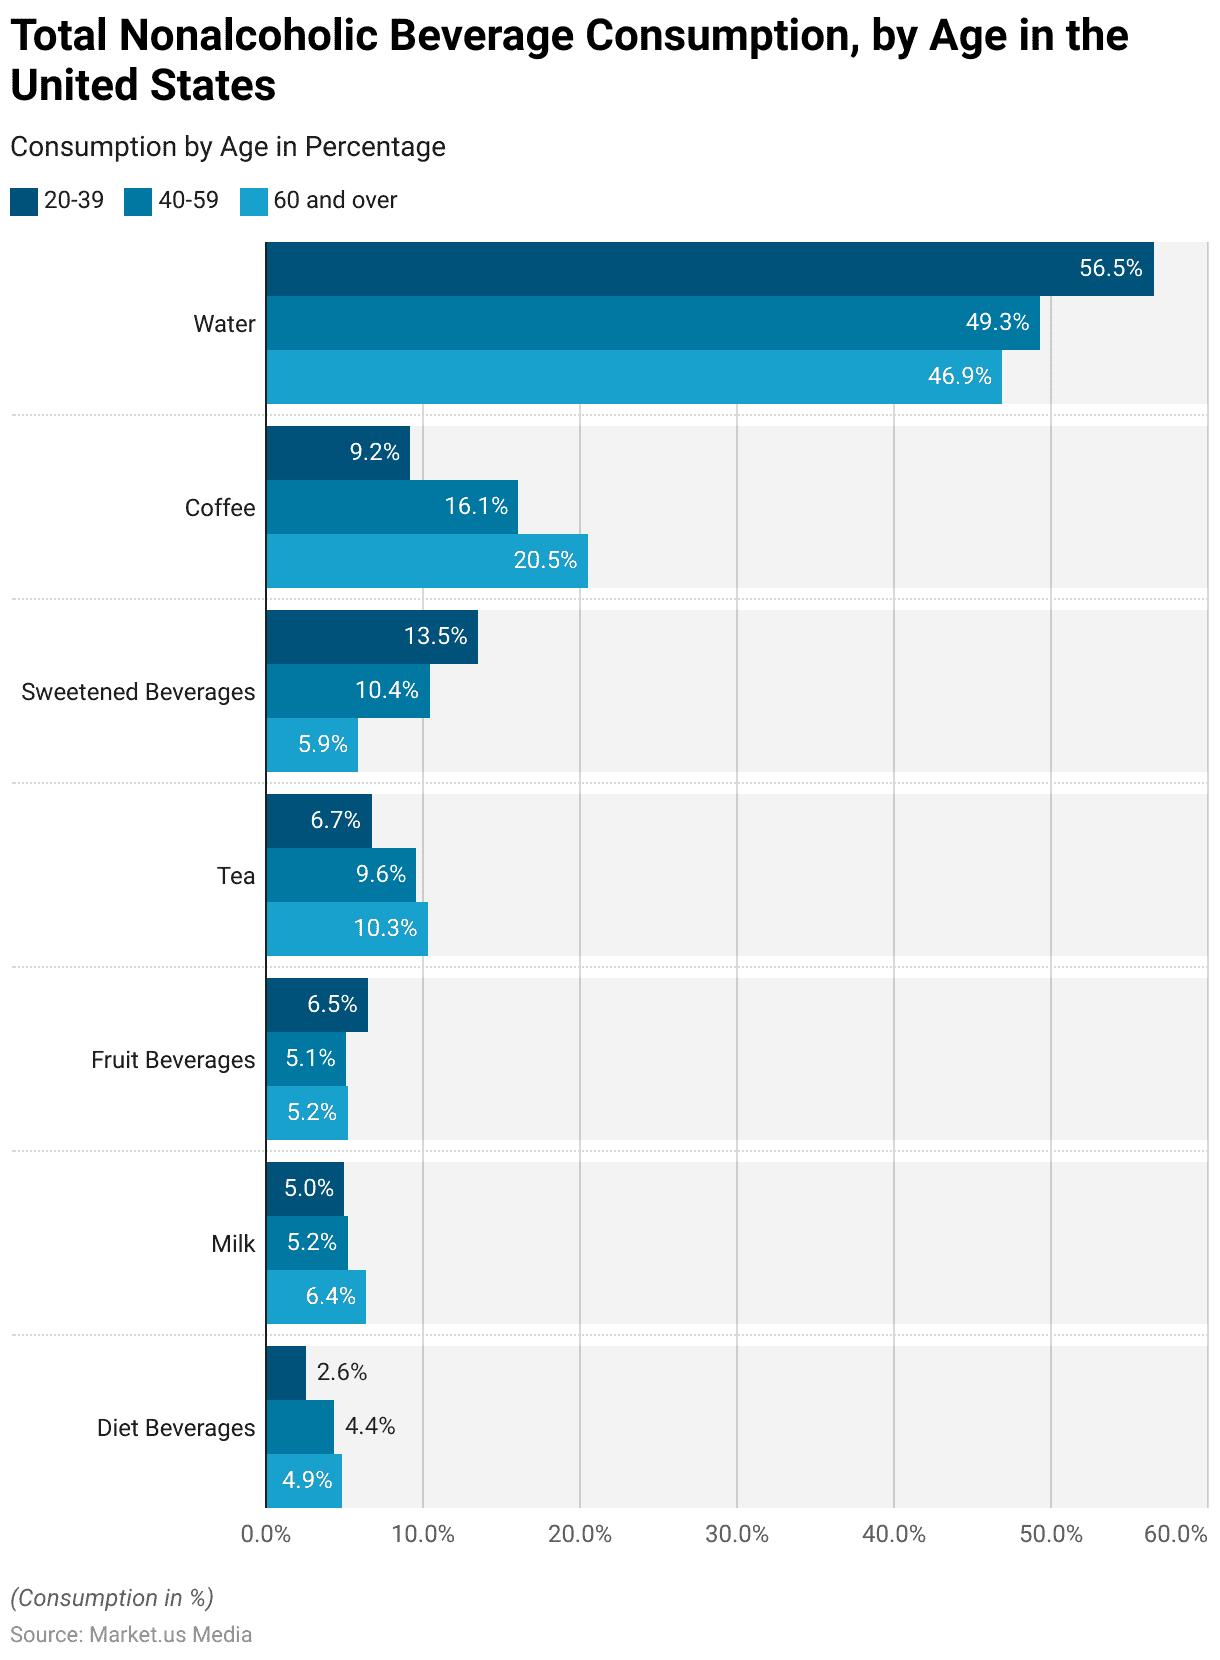
- Total non-alcoholic beverage consumption in the United States between 2015 and 2018 varied significantly across different age groups, revealing distinct preferences and trends.
- Among individuals aged 20-39, water emerged as the most consumed beverage, representing a substantial portion at 56.5%, followed by coffee at 9.2% and tea at 6.7%.
- Sweetened and fruit beverages also contributed significantly, with 13.5% and 6.5%, respectively.
- In the 40-59 age group, coffee consumption notably increased to 16.1%, surpassing tea and becoming the second most consumed beverage after water, which remained the dominant choice at 49.3%.
- Sweetened beverages, fruit beverages, and milk maintained relatively stable consumption levels.
- Interestingly, as individuals aged 60 and over, there was a notable shift towards coffee and tea, with coffee consumption reaching 20.5% and tea at 10.3%, reflecting perhaps a preference for warm beverages among older demographics.
- Water consumption remained high at 46.9%, indicating its continued importance across all age groups.
- These consumption patterns underscore the importance of understanding demographic preferences and evolving consumer trends in shaping the non-alcoholic beverage market in the United States.
(Source: CDC)
Gender-wise Preferences for Non-Alcoholic Beverages Statistics
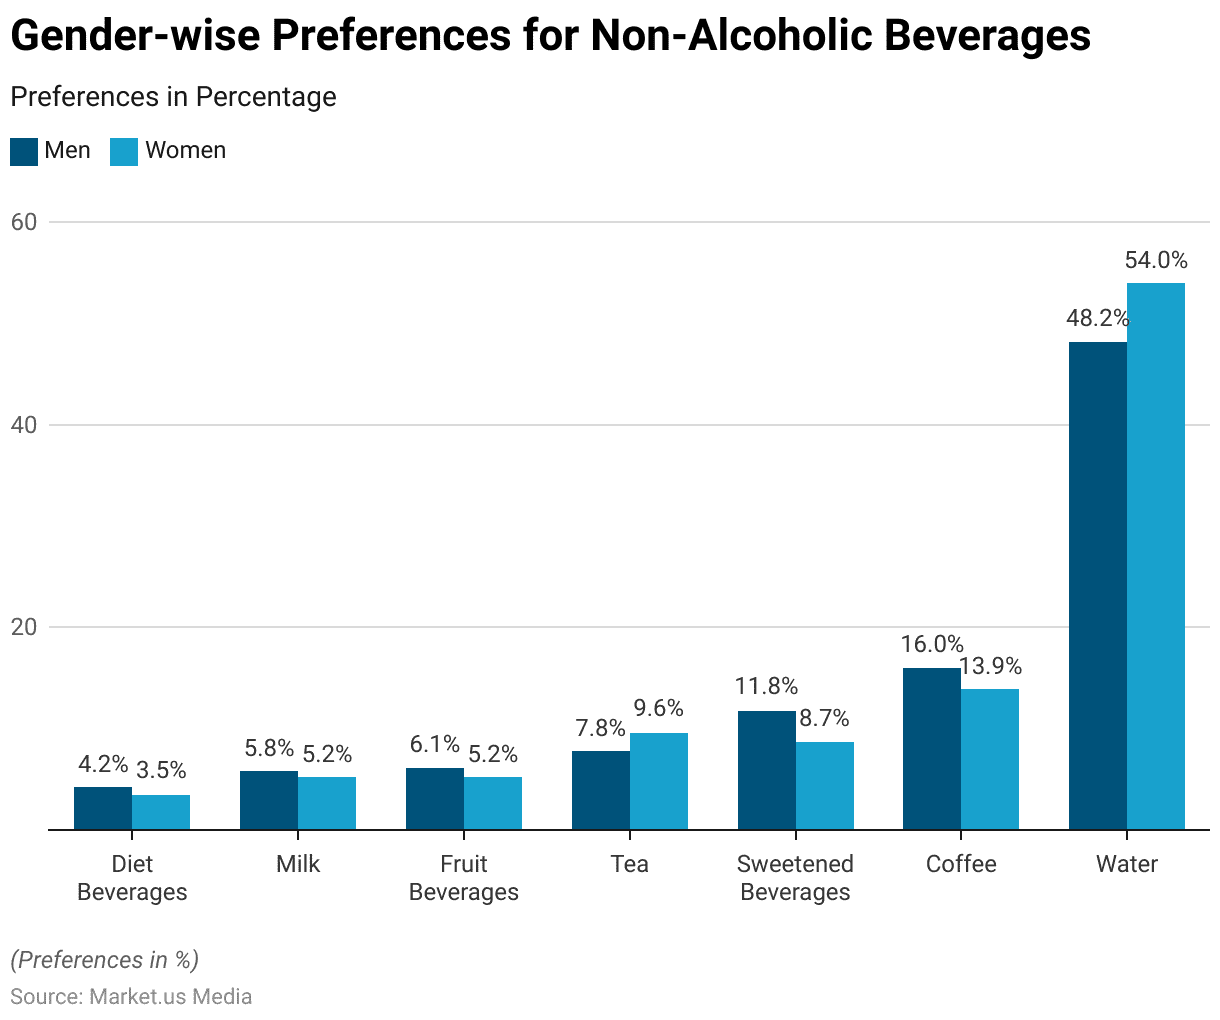
- Non-alcoholic beverage consumption patterns in the United States between 2015 and 2018 exhibited notable differences between genders, shedding light on distinct preferences among men and women.
- Among men, coffee emerged as the most consumed beverage, representing a significant portion at 16%, followed closely by water at 48.2%.
- Tea and sweetened beverages also garnered notable consumption rates at 7.8% and 11.8%, respectively.
- In contrast, women preferred water, with 54% reporting it as their beverage, followed by coffee at 13.9%.
- Tea consumption remained relatively consistent across genders; sweetened beverages were more prevalent among men, and women slightly more favored fruit beverages.
- Interestingly, men consumed slightly more diet beverages than women.
- These differences in consumption patterns highlight the importance of considering gender demographics when analyzing trends and developing targeted marketing strategies within the non-alcoholic beverage industry in the United States.
(Source: CDC)

Non-Alcoholic Beverage Sales Statistics
- According to NielsenIQ, the purchase of low and no-alcohol (LNA) beverages was reported in less than 5% of households, constituting 3.5% of the total alcohol market share.
- The NielsenIQ BASES report indicated a significant increase in product introductions, with 15 times the number of non-alcohol launches tested in 2021 compared to 2020.
- Over 52 weeks ending in late October 2021, sales of non-alcoholic beverages surged by 33%, while low-alcoholic beverage sales saw an 8% increase.
- Online sales of LNA beverages experienced a remarkable 315% growth between October 2020 and 2021, significantly outpacing the 26% increase in sales of alcoholic options.
- NielsenIQ researchers noted that purchasing non-alcoholic beverages wasn’t an exclusive choice, as 78% of those buying non-alcoholic beverages also purchased alcoholic options like beer, wine, and spirits.
- Consumer data from Drizly in 2021 revealed strong growth in sales for non-alcoholic wine, beer, and spirits, with non-alcoholic beer emerging as the platform’s top seller among non-alcoholic beverages.
- Within these categories, non-alcoholic liquor experienced a remarkable 200% year-over-year growth.
(Source: NielsenIQ)
Reasons for Choosing Non-Alcoholic Beverages Statistics
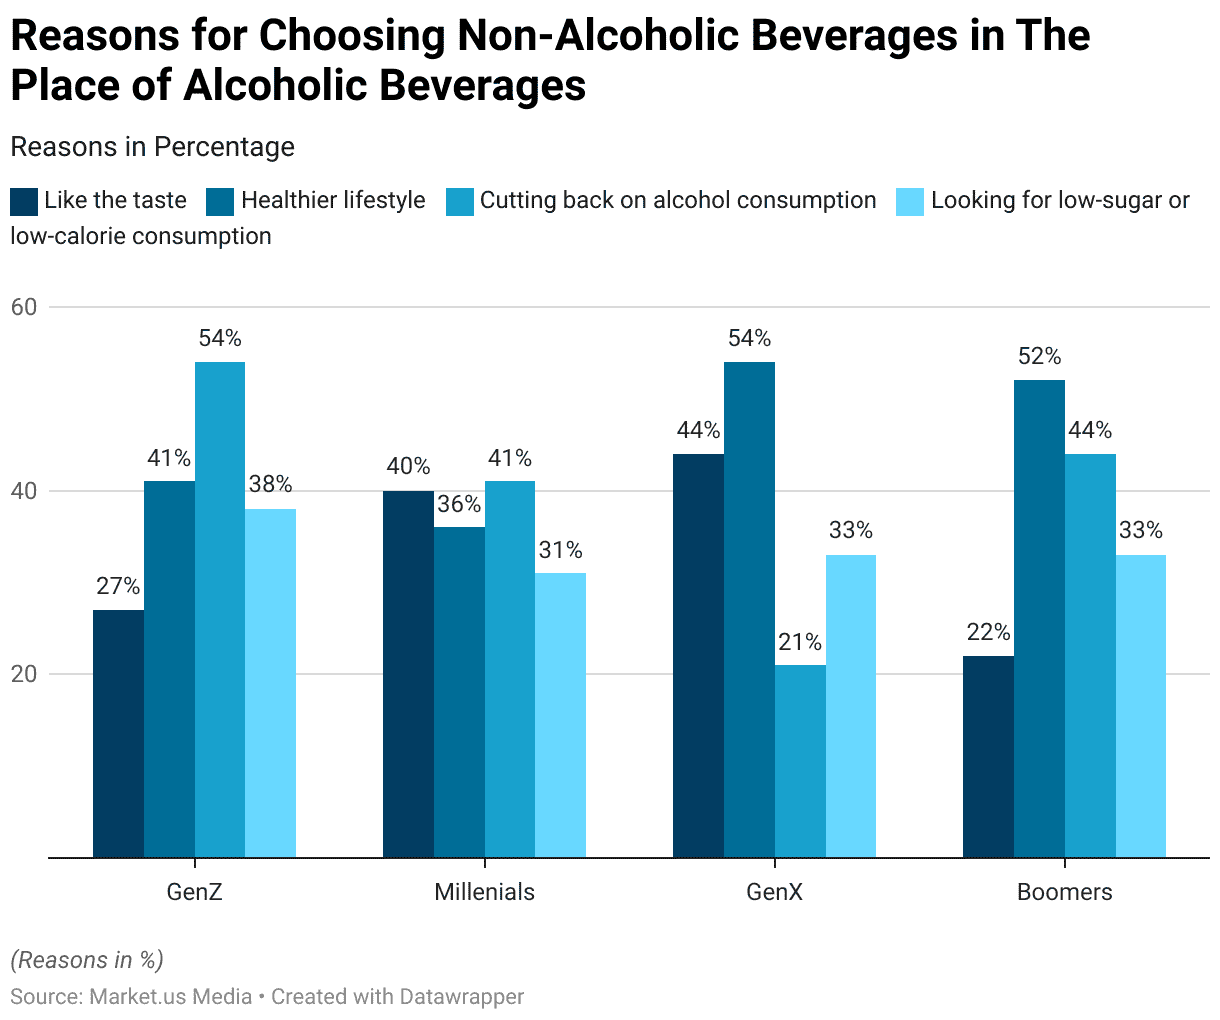
- Various factors across different age demographics drive the decision to consume more non-alcoholic beverages instead of alcoholic ones.
- Among Generation Z, Millennials, Generation X, and Baby Boomers, preferences vary but commonly include taste preference, health considerations, and efforts to reduce alcohol intake.
- Millennials and Generation X exhibit a greater inclination towards non-alcoholic beverages due to their pursuit of healthier lifestyles, with 41% and 54% respectively citing this as a motivating factor.
- Meanwhile, Generation X and Baby Boomers are more likely to opt for non-alcoholic beverages for their taste, with 44% and 22% indicating this preference, respectively.
- Additionally, across all age groups, there is a notable interest in non-alcoholic beverages for their low-sugar or low-calorie content, reflecting a broader trend towards healthier beverage choices among consumers of all generations.
(Source: Drizly)
Government Initiatives for Supporting Non-Alcoholic Beverages
- The Indian government has enacted policies to promote foreign direct investment (FDI) in the food processing industry. These measures allow for 100% FDI through automatic approval, with new companies facing a 15% FDI rate, while existing ones are taxed at 22% plus cess.
- Additionally, regulations concerning milk and milk products are detailed in the 1992 Milk and Milk Product Order (MMPO), exempting units handling limited quantities from permission requirements. New Dairy Processing Units enjoy a 100% Income Tax exemption on profits and gains for the initial five assessment years.
- Moreover, there has been a significant reduction in corporate tax rates, positioning India as one of the countries with the lowest corporate taxes after the 2019 budget announcement.
- The World Health Organization (WHO) urges alcohol producers and retailers to prioritize no-alcohol and lower-alcohol products in their portfolios to reduce overall alcohol consumption.
- The Department of Health and Social Care (DHSC) has committed to promoting NoLo alternatives to shift public alcohol consumption habits. By 2025, DHSC aims to significantly increase the availability of these products in retail and out-of-home sectors, including pubs, bars, and restaurants.
(Source: World Food India, Gov.UK)
Recent Developments
New Product Launches:
- Chamberlain Coffee: Launched a new line of ready-to-drink plant-based cold brew lattes in various flavors, available nationwide through Walmart from April 2023.
- Flow Beverage Corp: Introduced the Flow Vitamin-Infused Water line in three flavors, directly available to U.S. consumers via their official website from April 2022.
- Starbucks Corporation: Entered the energy drinks segment with the introduction of Starbucks BAYA Energy, enhancing its product range in January 2022.
Significant Investments:
- Milo’s Tea Company: Invested USD 130 million in building a new manufacturing and distribution facility in South Carolina, indicating a robust expansion strategy, operational from January 2023.
Acquisitions and Partnerships:
- The beverage sector also witnessed strategic expansions with companies like Varun Beverages expanding its reach by acquiring The Beverage Company for approximately 13.2 billion rupees, marking a significant expansion into Africa as reported in early 2024.
- PepsiCo acquired Rockstar Energy Drinks for $3.85 billion, aiming to strengthen its position in the energy drinks segment and diversify its product offerings.
- Keurig Dr Pepper entered into a partnership with Beyond Meat to launch a range of plant-based beverages, leveraging Beyond Meat’s expertise in plant-based protein.
Sustainability Initiatives and Consumer Trends:
- Beverage companies are increasingly focusing on sustainable packaging solutions, such as plant-based bottles and recyclable materials, in response to growing consumer concerns about environmental impact.
- The demand for healthier and functional beverages, such as herbal teas and vitamin-infused waters, is driving innovation in product formulations and flavors.
Conclusion
Non-alcoholic Beverages Statistics – The non-alcoholic beverages sector is thriving and evolving, fueled by changing consumer tastes, health awareness, and innovative products.
Offering a wide array of options like sodas, bottled water, fruit juices, and functional drinks, the market presents ample expansion opportunities.
Key players such as Coca-Cola, PepsiCo, and Nestlé lead the industry, leveraging innovation and brand strength. Growing consumer preferences for healthier choices and reduced alcohol consumption drive market growth.
With increasing regulatory scrutiny and sustainability concerns, companies must prioritize compliance and eco-conscious practices to maintain consumer trust.
The non-alcoholic beverages industry is poised for sustained growth, responding to consumer demands for healthier and more sustainable beverage alternatives.
FAQs
Non-alcoholic beverages are drinks that contain little to no alcohol. They include various options such as sodas, bottled water, fruit juices, teas, coffees, and functional beverages.
In general, non-alcoholic beverages are considered healthier than alcoholic ones because they typically contain fewer calories and no alcohol. However, this can vary depending on each beverage’s specific ingredients and additives.
Popular non-alcoholic beverages include carbonated soft drinks (e.g., cola, lemon-lime sodas), bottled water, fruit juices (e.g., orange juice, apple juice), teas (e.g., green tea, herbal tea), coffees (e.g., black coffee, lattes), and functional drinks (e.g., energy drinks, sports drinks).
Non-alcoholic beverages are becoming more popular due to changing consumer preferences, increasing health consciousness, and the introduction of innovative products. Consumers are seeking healthier beverage options, driving demand for beverages with natural ingredients, functional benefits, and lower sugar or calorie content.
Major multinational corporations like The Coca-Cola Company, PepsiCo, and Nestlé dominate the non-alcoholic beverages market. These companies offer various products and compete through innovation, brand recognition, and strategic partnerships.
Discuss your needs with our analyst
Please share your requirements with more details so our analyst can check if they can solve your problem(s)