


Medicaid Statistics: Medicaid is a joint federal and state program in the United States that provides health coverage to low-income individuals and families, including children, pregnant women, adults, seniors, and people with disabilities.
It is the largest source of health coverage in the country, Serving millions of Americans. Medicaid statistics provide valuable insights into the program’s enrollment, expenditures, demographics of beneficiaries, coverage, and benefits, impact on health outcomes, and other related factors.

Editor’s Choice
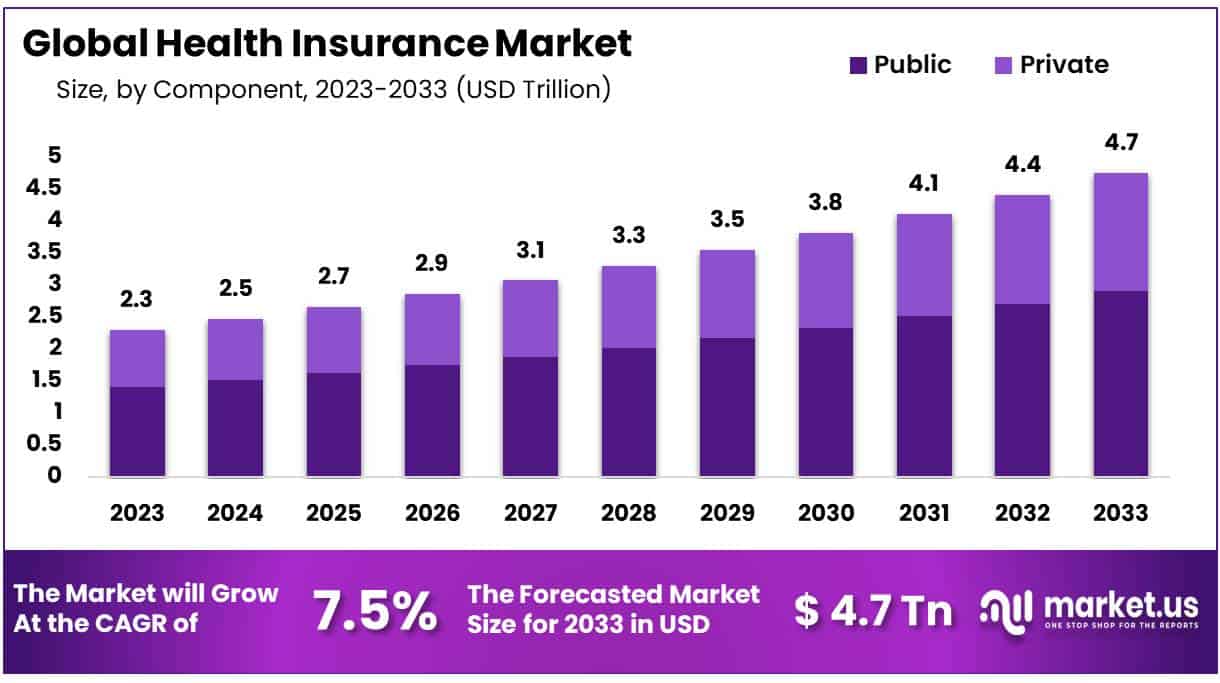
- The global Health Insurance Market was valued at USD 2.3 Trillion in 2023 and is further projected to register substantial growth of USD 4.7 Trillion by 2033, with a 7.5% CAGR.
- Medicaid and CHIP enrollment numbers from March 2023 showed that 93,876,834 people were enrolled across 50 states and D.C.
- As of May 2022, approximately 12.6 million California residents had enrolled in Medicaid health insurance programs – comprising roughly 14% of the 89.4 million nationwide enrollees (89 million).
- As of April, there were 86,714,574 individuals enrolled in Medicaid.
- 7,162,260 individuals were enrolled in CHIP.
- The total Medicaid expenditure was about $616.1 billion in 2022.
- The federal expenditures in 2018 were about $386 billion in 2022.
- The state expenditure on Medicaid was about $229.6 billion.
- From 2018-2027, Medicaid expenditures are anticipated to increase at an annual average rate of 5.3% and reach $1,0007.9 billion by 2027.
- The United States has the highest expenditure on healthcare per capita globally. Medicaid accounted for 19% of health expenditure in 2022.
- Estimates suggest that over time, the federal government will cover approximately 60% of total Medicaid costs; states will cover 40%.
- About 17.8% of Americans were covered by Medicaid in 2020, and 18.9% in 2021.
(Source: Medicaid.gov, CMS, Statista)
Distribution of U.S. Healthcare Expenditure by Payer (2015-2022)
Medicaid Enrollment Statistics by State
- California: Approximately 12 million.
- New York: Approximately 7 million.
- Texas: Approximately 4.5 million.
- Florida: Approximately 4.2 million.
- Pennsylvania: Approximately 3 million.
- Ohio: Approximately 3 million.
- Illinois: Approximately 2.8 million.
- Michigan: Approximately 2.7 million.
- North Carolina: Approximately 2.5 million.
- Georgia: Approximately 2.4 million.
(Source: California Department of Health Care Services, New York State Department of Health, Texas Health and Human Services Commission, Agency for Health Care Administration, Florida, Pennsylvania Department of Human Services, Ohio Department of Medicaid, Illinois Department of Healthcare and Family Services, Michigan Department of Health and Human Services, North Carolina Division of Health Benefits, Georgia Department of Community Health)
Medicaid Enrollment Statistics by Eligibility Group
- Children: Approximately 36 million children were enrolled in Medicaid.
- Adults: The number of adults enrolled in Medicaid varies based on eligibility criteria and state-specific factors. As of the most recent data available, there were approximately 27 million adults enrolled in Medicaid.
- Individuals with disabilities: Approximately 10 million individuals with disabilities were enrolled in Medicaid.
- Seniors: There were approximately 8 million seniors enrolled in Medicaid.
- Pregnant women: Around 2 million pregnant women were enrolled in Medicaid.
(Source: CMS)
Medicaid Enrollment Trends Over the Time Statistics
- In 2010, approximately 50 million people enrolled in Medicaid.
- In 2015, around 72 million people enrolled in Medicaid.
- In 2020, approximately 75 million people enrolled in Medicaid.
- Between 2010-2015 Medicaid enrolment increased by about 22 million.
- Between 2015 and 2020, the total Medicaid enrolment increased by about 22 million.
(Source: Kaiser family)
Medicaid Expenditures Statistics by State
- California: In 2021, California’s total Medicaid expenditures amounted to $116.8 billion.
- New York: New York’s total Medicaid expenditures reached $77.2 billion in 2021.
- Texas: Total Medicaid expenditures in Texas for 2021 were approximately $72.6 billion.
- Florida: Florida’s total Medicaid expenditures amounted to $29.7 billion in 2021.
- Pennsylvania: In 2021, Pennsylvania’s total Medicaid expenditures were around $30.8 billion.
- Ohio: Total Medicaid expenditures in Ohio for 2021 reached $28.3 billion.
- Illinois: Illinois reported total Medicaid expenditures of $28.6 billion in 2021.
- Michigan: Michigan’s total Medicaid expenditures amounted to $26.3 billion in 2021.
- North Carolina: Total Medicaid expenditures in North Carolina for 2021 were approximately $18.8 billion.
- Georgia: Georgia reported total Medicaid expenditures of $15.1 billion in 2021.
(Source: Medicaid.gov)
Age Distribution of Medicaid Beneficiaries
- Children: In 2020, approximately 40% of Medicaid beneficiaries were children under the age of 18.
- Adults: Adults aged 19 to 64 accounted for about 29% of Medicaid enrollees in 2020.
- Elderly: In 2020, individuals aged 65 and older constituted around 12% of Medicaid beneficiaries.
- Disabled: Approximately 14% of Medicaid beneficiaries in 2020 were individuals with disabilities.
- Dual Eligible: Dual eligible, who qualify for both Medicaid and Medicare, represent a significant portion of Medicaid beneficiaries. In 2020, they accounted for about 15% of Medicaid enrollment.
(Source: Medicaid.gov)
Racial and Ethnic Distribution of Medicaid Beneficiaries
In 2021, the racial and ethnic composition of Medicaid beneficiaries in the United States was as follows:
- In the United States, approximately 40.3% were White.
- Approximately 18.6% were Black.
- Approximately 29.2% were Hispanic.
- Approximately 4.7% were Asian/Native Hawaiian and Pacific Islander.
- Approximately 0.9% were American Indian/Alaska Native.
- Around 6.3% were of Multiple Races.
Medicaid and Long-Term Care
- In 2021, Medicaid financed approximately 51% of all nursing home care expenditures in the United States.
- As of 2021, over 4.6 million individuals received long-term care services and support through Medicaid’s Home and Community-Based Services (HCBS) waivers.
- HCBS spending accounted for about 57% of Medicaid long-term care spending in 2021.
- In 2021, total Medicaid spending on long-term care services was approximately $177 billion.
- Medicaid’s share of total national long-term care spending was about 37% in 2021.
(Source: Kaiser Family Foundation)
Medicaid Fraud and Abuse
- The estimated amount of Medicaid fraud in the United States ranges from $19 billion to $65 billion annually.
- In fiscal year 2020, the Medicaid Fraud Control Units (MFCUs) obtained 1,423 criminal convictions related to Medicaid fraud and abuse.
- In the same year, MFCUs initiated 1,136 civil cases and 1,275 administrative actions related to Medicaid fraud and abuse.
- Medicaid fraud investigations resulted in the recovery of over $2.6 billion in fiscal year 2020.
- Approximately 10% of Medicaid payments are estimated to be improper, resulting from fraud, waste, or abuse.
- The estimated percentage of fraudulent payments within the Medicaid program ranges from 3% to 10%.
(Source: OIG, CMS)
Medicaid and the Affordable Care Act (ACA)
- Before the Affordable Care Act (ACA) was introduced, around 50 million Americans, or one out of every six, did not have health insurance.
- The United States spent almost 17% of its GDP on healthcare, the highest among developed countries.
- In comparison, Australia’s healthcare spending was around 9% of GDP, and Germany’s was around 11%.
- Surveys conducted in 2008 showed that over 80% of Americans were in favor of an overhaul of the healthcare system.
- As of 2021, approximately 31 million individuals have gained healthcare coverage through ACA-related enrollment in programs such as Medicaid or insurance purchased from the Marketplace.
- One study estimated that during the four years after 29 states expanded Medicaid, approximately 19.2 thousand lives were saved from treatable conditions like heart disease and diabetes.
- Opponents of the ACA spent around $420 million on TV ads to portray the law negatively.
- Supporters of the ACA spent only $27 million supporting the law.
(Source: Statista)
Recent Developments
Legislative Changes and Funding Allocation:
- Government bodies passed legislation to expand Medicaid coverage and increase funding for healthcare services to low-income individuals and families.
- Budget allocations for Medicaid programs were increased to support the growing number of enrollees and address healthcare disparities among underserved populations.
Telehealth Expansion:
- Medicaid programs expanded coverage for telehealth services, allowing beneficiaries to access virtual consultations with healthcare providers from the comfort of their homes.
- Reimbursement policies were updated to include telehealth visits for a wide range of healthcare services, including primary care, mental health, and chronic disease management.
Value-Based Care Initiatives:
- Medicaid agencies implemented value-based care models to incentivize healthcare providers to deliver high-quality, cost-effective care to Medicaid beneficiaries.
- Payment reforms, such as accountable care organizations (ACOs) and bundled payments, were introduced to promote care coordination and improve health outcomes while controlling costs.
Managed Care Contracting:
- Medicaid programs expanded managed care enrollment, contracting with managed care organizations (MCOs) to administer healthcare benefits and coordinate care for Medicaid beneficiaries.
- Competitive bidding processes were conducted to select MCOs and negotiate contracts based on performance metrics and quality standards.
Medicaid Waivers and Flexibility:
- States pursued Medicaid waivers to implement innovative delivery models and tailor program requirements to meet the unique needs of their populations.
- Waivers were granted to test Medicaid expansion alternatives, such as work requirements, premium assistance, and health savings accounts.
Social Determinants of Health Integration:
- Medicaid programs integrated social determinants of health (SDOH) initiatives to address non-medical factors that impact health outcomes, such as housing instability, food insecurity, and transportation barriers.
- Community partnerships and care coordination efforts were established to connect Medicaid beneficiaries with social services and resources to address SDOH needs.
Data Analytics and Performance Monitoring:
- Medicaid agencies leveraged data analytics and performance monitoring tools to track healthcare utilization, identify trends, and evaluate program effectiveness.
- Quality improvement initiatives were implemented based on data-driven insights to enhance care delivery and population health outcomes.
Final Words
Medicaid Statistics – Medicaid is crucial in providing health coverage to millions of low-income individuals and families in the United States.
The program’s enrolment numbers have steadily increased over the years, with millions of people relying on it for essential healthcare services. Medicaid expenditures have also been on the rise, reflecting the program’s significant financial impact.
The racial and ethnic distribution of beneficiary’s highlight’s the program’s diversity in serving various communities. However, Medicaid is not without its challenges, as fraud and abuse continue to be areas of concern.
Overall, Medicaid remains a vital safety net for vulnerable populations and continues to shape the healthcare landscape in the country.
FAQs
Medicaid is a joint federal and state program in the United States that provides health coverage to low-income individuals and families. It is the largest source of health coverage in the country and serves various groups, including children, pregnant women, adults, seniors, and people with disabilities.
As of March 2023, there were 93,876,834 people enrolled in Medicaid across the 50 states and D.C.
Medicaid enrollment varies by state. Some states with large populations, such as California and New York, have millions of residents enrolled, while smaller states may have fewer enrollees. For example, as of May 2022, California had approximately 12.6 million enrollees, while New York had approximately 7 million.
Medicaid enrollment has increased over the years. In 2010, approximately 50 million people were enrolled, and by 2015, the number had risen to around 72 million. As of 2020, approximately 75 million people were enrolled in Medicaid.
In 2022, the total Medicaid expenditure was about $616.1 billion. The federal government covered around $386 billion of this amount, while states covered approximately $229.6 billion.
Discuss your needs with our analyst
Please share your requirements with more details so our analyst can check if they can solve your problem(s)