


Introduction
Education Catering Statistics: Education catering involves planning, preparing, and serving meals in educational institutions like schools and universities.
It’s all about ensuring that students get nutritious, balanced meals while accommodating dietary preferences and maintaining food safety standards.
Meal programs, like breakfast and lunch, often aim to provide affordable, healthy options for students. Sustainability is a growing concern, with efforts to source local and eco-friendly ingredients.
Beyond nourishment, education catering can foster cultural appreciation and social connections through shared dining experiences.
Feedback from students and staff helps improve the quality of food and service, while strict adherence to regulations ensures everyone’s safety and health.
Editor’s Choice
- The education catering market is segmented based on – contract types, applications, and regions.
- 117 countries (60.93%) have school-based feeding programs (SPF) and 8 countries (4.16%) do not have SPF among the 192 countries in the World Food Program.
- 418 million children globally who are benefiting from meal programs as of 2022.
- India saw a great increase in the no. of students in school meal programs from 90 million in 2020 to 108 million in 2022.
- Low-income countries saw a decrease of 4% in the total no. of students under school meal programs.
- Increased costs and staff shortages are the biggest challenges faced with 88.5% and 59.4% responses.
- About 22.6% of undergraduates struggle with food insecurity and 12.2% of graduate students face the same.
Education Catering School Feeding Program Statistics
- Out of 192 countries in the World Food Programme (WFP): 117 countries (60.93%) have school-based feeding programs (SPF) and 8 countries (4.16%) do not have SPF.
- Among these countries with SPFs:100% have detailed nutritional aspects, 11.96% include cultural aspects, 16.23% focus on food safety, and 23.93% involve agro-family participation.
- In 67 countries (34.89%), there is no official online resource for SPF information.
- Europe and Central Asia have the most comprehensive school-based feeding programs.
(Source: National List of Medicines)
The State of School Feeding Worldwide 2022
- At present, there are 418 million children globally who are benefiting from meal programs, This marks a notable rise of 30 million children, which accounts for about 7% more than the 388 million children reported in 2020.
(Source: World Food Program)
Education Catering Statistics by Regional Distribution in 2022
- There was a significant increase in children receiving school meals from 2020 to 2022, 94% of this increase was driven by 20 countries.
- India saw the largest increase, with 16 million more children fed (106 million in 2022, up from 90 million in 2020).
- Top Five Countries with the Most Children Receiving School Meals: Brazil, Russia, India, China, and South Africa account for nearly half of all children receiving school meals.
- These five countries contributed to 19 million of the 30 million increase in children receiving school meals between 2020 and 2022.
- Changes in China’s Data: China’s reported number of children receiving school meals dropped from 40 million to 37 million in two years.
- This decrease is mainly linked to a program for poor and vulnerable rural children and factors like reduction in poverty levels and rural-to-urban migration in China.
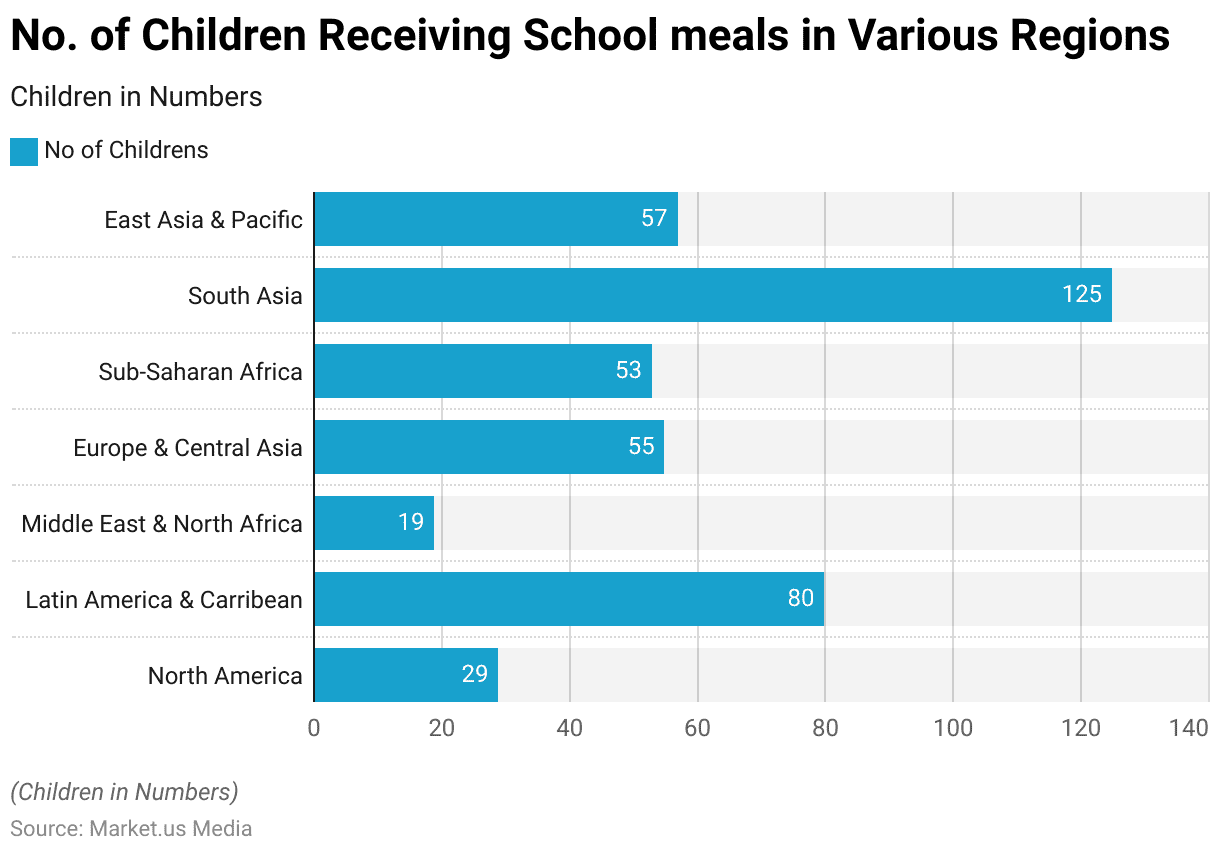
- South Asia had the most children receiving school meals, with 125 million beneficiaries.
- Latin America and the Caribbean had 80 million beneficiaries.
- East Asia and the Pacific had 57 million beneficiaries.
- Sub-Saharan Africa had 53 million beneficiaries.
(Source: World Food Program)
Education Catering Changes in the Scale of Meal Distribution Statistics
- The study assessed changes in program size between 2020 and 2022, focusing on 163 countries with available data for both years.
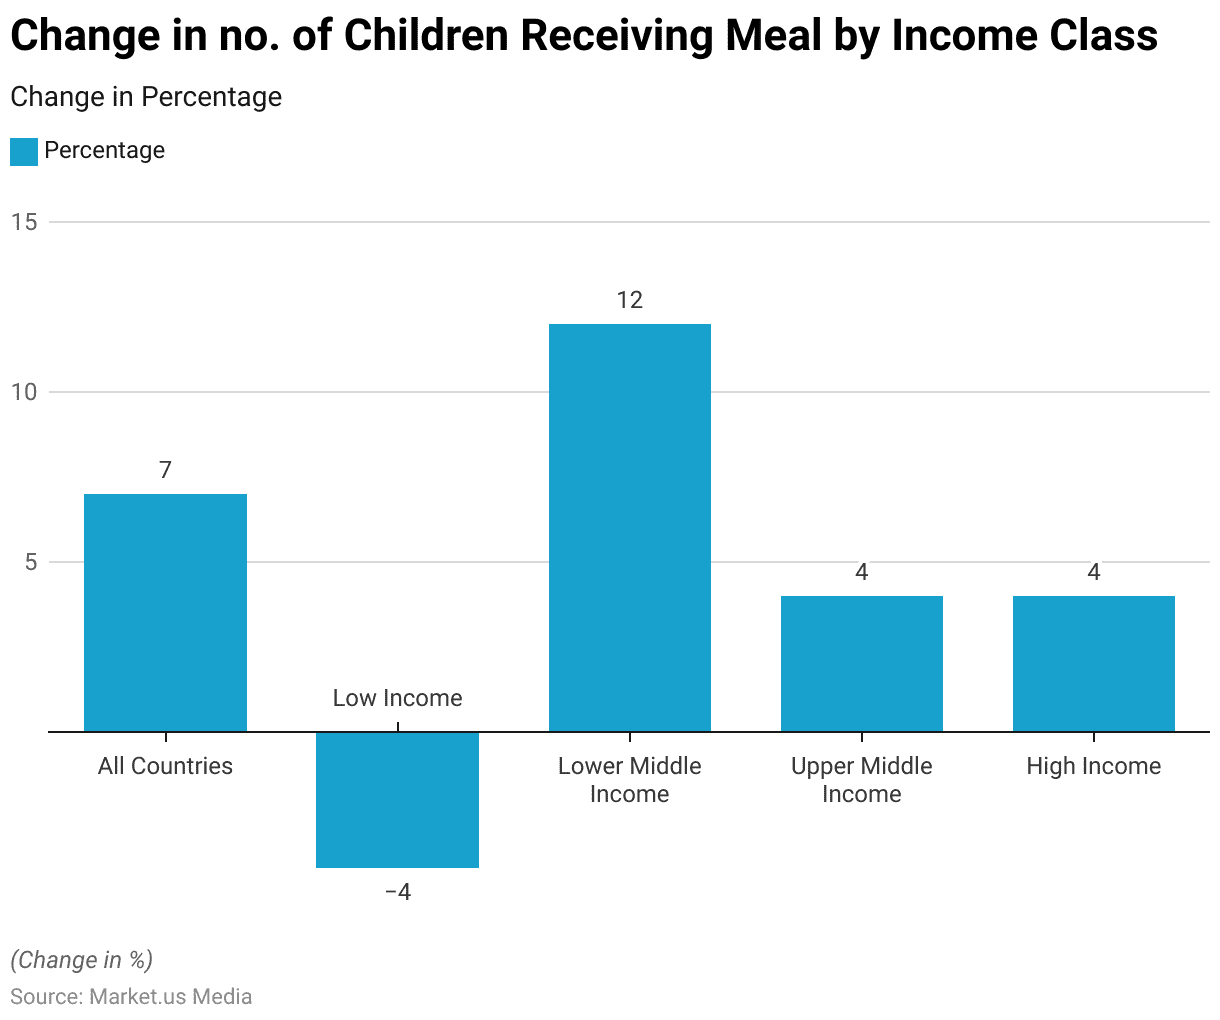
- The most recent data indicates an increase in the number of children benefiting from school meals worldwide since 2020, with an approximately 7 percent rise.
- However, this trend doesn’t apply consistently across different income groups. For example, a drastic 4 percent decrease was observed in low-income countries.
- Conversely, high-income countries, upper-middle-income countries, and lower-middle-income countries all show a consistent and moderate increase, with respective growth rates of 4 percent, 4 percent, and 12 percent.
(Source: World Food Program)

Challenges for School Meal Program
- School meal programs encounter several challenges, as indicated by survey respondents.
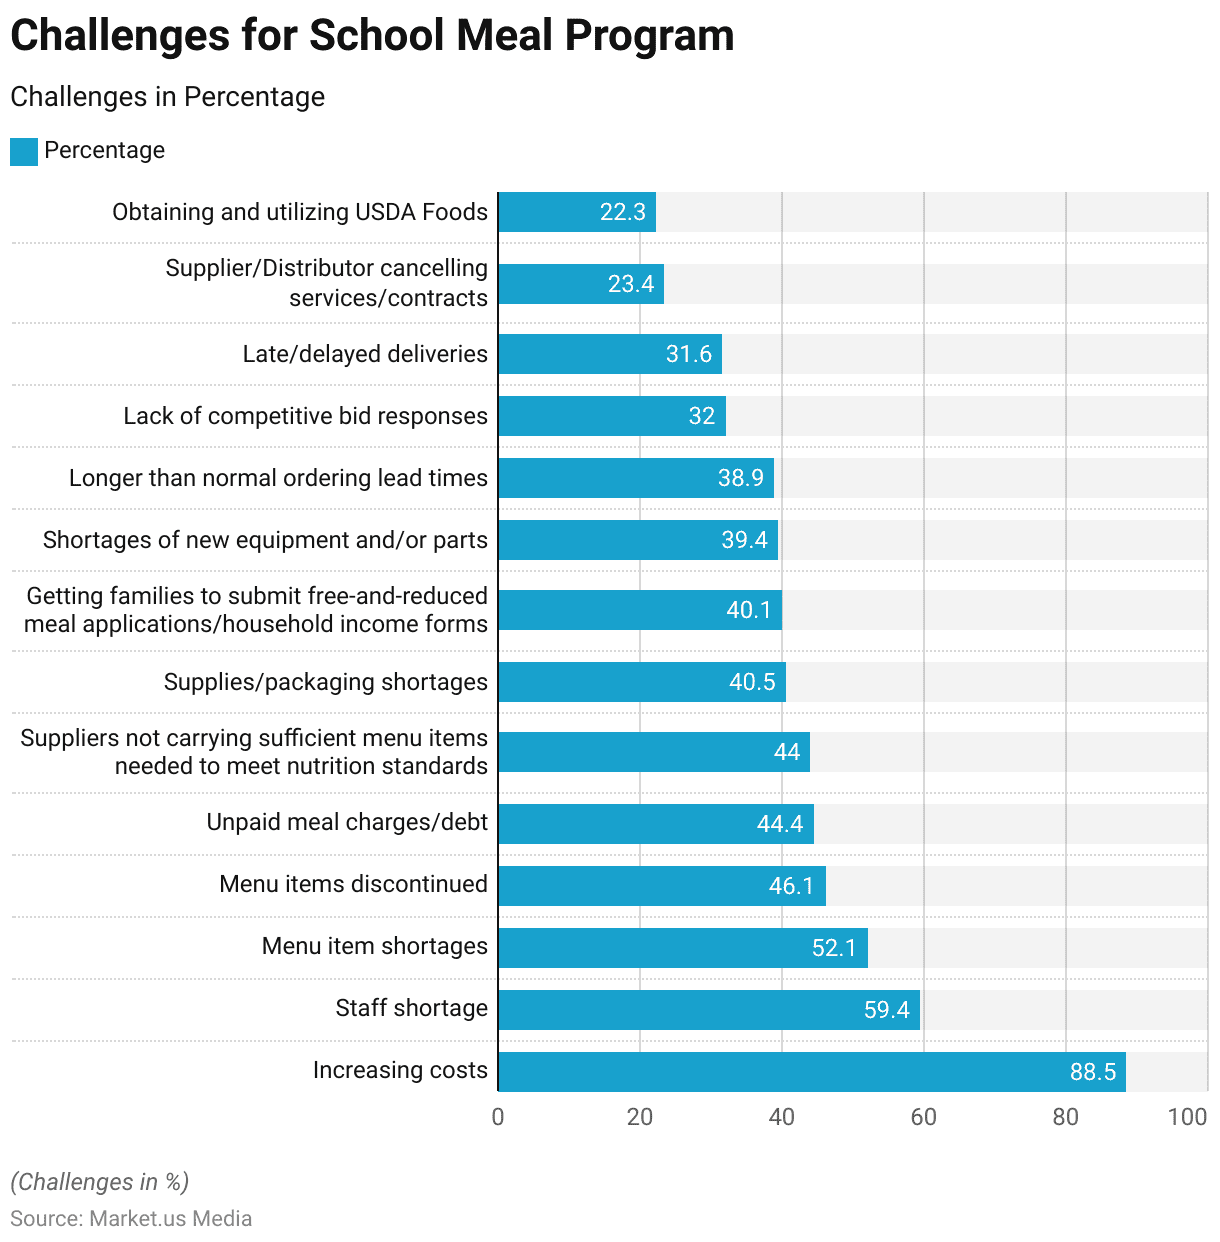
- The most prevalent issue, identified by 88.5% of respondents, is the increasing costs associated with running these programs.
- Staff shortages are another significant concern, with 59.4% of respondents highlighting this challenge.
- Additionally, 52.1% of respondents face menu item shortages, while 46.1% have encountered menu items being discontinued.
- Managing unpaid meal charges and debt is a concern for 44.4% of respondents, and 44% report difficulties with suppliers not carrying sufficient menu items that meet nutrition standards.
- Other challenges include shortages in supplies and packaging (40.5%), encouraging families to submit free-and-reduced meal applications/household income forms (40.1%), and shortages of new equipment and parts (39.4%).
- Other challenges like longer-than-normal ordering lead times (38.9%), a lack of competitive bid responses (32%), late or delayed deliveries (31.6%), and supplier or distributor cancellations of services/contracts (23.4%), and the task of obtaining and utilizing USDA Foods (22.3%) are also faced.
- These challenges encompass financial, operational, and administrative aspects of managing school meal programs.
(Source: School Nutrition Association)

The Nutrition Standards and Meal Requirements
- Meal planning can take two distinct approaches: food-based menu planning (FBMP) and nutrient-based menu planning (NBMP).
- FBMP focuses on selecting various food groups and ingredients to create well-rounded meals. Following dietary guidelines, and recommending servings from different categories like grains, proteins, fruits, vegetables, and dairy.
- On the other hand, NBMP relies on computer software to calculate the precise nutritional content of foods and meals, ensuring they meet specific nutrient requirements and dietary guidelines.
- The table provides detailed nutritional values for lunch and breakfast meals. Categorized by grade levels that are currently followed as per USDA.
- These values include calorie counts, with lunch ranging from 517 to 785 calories and breakfast ranging from 388 to 825 calories.
- The fat content is consistently maintained below 30% of calories, while saturated fat remains under 10%.
- Protein content varies from 7g to 16g in lunch and from 5g to 12g in breakfast. Calcium levels range from 200mg to 400mg, and iron content varies from 2.5mg to 4.5mg.
- Vitamin A levels range from 113 to 300 RAE, while vitamin C content ranges from 11mg to 18mg.
- These standards aim to ensure that meals served to students of different grade levels adhere to specific nutritional guidelines, contributing to their overall well-being.
(Source: National List Of Medicines & Table Derived from USDA)
College Meal Trends
Education Catering Environment assessments Statistics
- It was found that a significant presence of unhealthy food and beverage options, like sweet snacks and sugary drinks, made up a substantial portion of solid food (58.5%) and total drinks (23.5%).
- In contrast, it was noted that a higher number of “healthy” food outlets (17.8%), suggesting the availability of healthy food choices on campus, surpassing less healthy options (3.6%). (Source: National List of Medicines, Martinez-Perez, et al & Roy et al)
- A collected data from student responses regarding dietary habits and food availability in the university’s food environment, particularly regarding fruit and vegetable consumption.
- Their findings showed that about a quarter of students met the recommended fruit intake (27.9%), while adherence to vegetable guidelines was notably lower (6.8%).
(Source: National List of Medicines, Van den Bogerd et al)
Education Catering Food Insecurity Statistics
- Food insecurity is a global concern among university students, with prevalence rates varying by country.
- In Australia, studies found rates ranging from 38% to 48%, while in Lebanon, 39% of students were affected.
- This issue also affects academic performance, as seen in Malaysia where food-insecure students tend to have lower GPAs.
- In Canada, 39.5% of students in Saskatchewan and over 35% in other universities experience food insecurity. Indigenous students are more vulnerable to severe food insecurity.
(Source: National List of Medicines)
Food Insecurity in College Education
- Undergraduates: About 22.6% of undergraduates struggle with food insecurity. An additional 11.9% have marginal food insecurity. This totals around 3.9 million undergraduates facing food insecurity.
- Graduate Students: 12.2% of graduate students experience low or very low food security. 8.6% have marginal food security. Over 400,000 graduate students face food insecurity.
- Institution Sector: Community colleges have the highest food insecurity rate at 23.4%. Public and private non-profit 4-year institutions follow at 20.9% and 18.8%, respectively. For-profit colleges have the highest rate at 32.9%.
- Minority-Serving Institutions: Historically Black Colleges and Universities (HBCUs) report a 38.8% food insecurity rate. Tribal Colleges and Universities (TCUs) have a 35.5% food insecurity rate.
- Racial and Ethnic Disparities: Food insecurity rates are higher for Black, Native Hawaiian/Pacific Islander, and American Indian/Alaska Native students compared to White and Asian students.
- Gender: Women undergraduates have a 24.3% food insecurity rate, while men have 19.7%. Genderqueer, gender nonconforming, or non-binary gender students face a 35% food insecurity rate.
- The intersection of Race and Gender: Pacific Islander/Hawaiian women have the highest rates 37.7%. Black women follow at 35.7%, and Black men at 32.2%. White men have the lowest rate 15.2%.
- Parenting Status: Parenting students experience a 28.7% food insecurity rate among undergraduates. Single parents face an alarming 37.3% food insecurity rate.
- Disability: Nearly 36% of undergraduates with disabilities experience food insecurity, compared to 19.1% without disabilities. Among graduate students, those with disabilities 26.4% have higher rates than those without 10.5%.
(Source: The Hope Survey, Temple University)
Recent Developments
List of Activities
- Instructure’s Acquisition of Parchment for $835 Million (2023): Strengthening its position in the student success market, Instructure incorporated Parchment’s credential verification and e-portfolio tools into its offerings.
- Learneo’s Purchase of Barnes & Noble Digital Student Solutions for $300 Million (2023): This acquisition consolidated online learning resources and learning management systems (LMS) under Learneo.
- Frontline Education Acquired by Roper Technologies for $3.7 Billion (2023): The acquisition expanded Roper’s presence in K-12 software solutions, adding administrative and financial management tools to its portfolio.
- Blackbaud’s Acquisition of EverFi for $750 Million (2023): Targeting compliance training programs, Blackbaud aimed to enhance its offerings for non-profit and educational sectors.
- ACI Learning’s Acquisition of Infosec Learning: Focused on creating a leading cybersecurity training provider by merging ACI’s corporate focus with Infosec’s offerings targeted at individual learners.
Increased M&A Activity Post-2020:
- The total value of M&A transactions in the education sector grew significantly in the first half of 2021, with 240 acquisitions, driven largely by substantial deals such as Platinum Equity’s acquisition of McGraw Hill for $6.4 billion.
- Notable deals include Byju’s $900 million acquisition of Aakash Educational Services and Renaissance’s $650 million acquisition of Nearpod.
Trends and Outlook for 2024:
- A continued focus on AI, VR, and ML technologies, is set to redefine the educational landscape by enhancing personalized learning and immersive educational experiences.
- Strategic consolidations are expected to continue as firms seek to expand their reach and capabilities in response to growing market demands.
Conclusion
Education Catering Statistics – In conclusion, education catering is vital to educational institutions. Ensuring students have access to nutritious meals and supporting their overall well-being and academic performance.
It encompasses a range of considerations, including menu planning, dietary accommodations, food safety, sustainability, and cultural diversity.
Through meal programs and continuous improvement efforts, education catering plays a significant role in promoting healthy eating habits and creating a positive student dining experience.
Compliance with regulations ensures the safety and health of all consumers. While a focus on sustainability aligns with broader environmental goals.
Education catering not only nourishes the body but also contributes to a sense of community and cultural appreciation within educational settings.
FAQs
Education catering refers to the provision of food services within educational institutions such as schools, colleges, and universities. It includes preparing and serving meals to students, faculty, and staff.
Catering plays a crucial role in ensuring that students receive nutritious and balanced meals during their academic day. Proper nutrition can enhance students’ learning capabilities and overall well-being.
In many countries, efforts have been made to improve the nutritional quality of school meals. School meal programs often aim to provide a balanced diet that includes fruits, vegetables, lean proteins, and whole grains.
Schools can accommodate dietary restrictions and allergies by offering alternative menu items. Clearly labeling allergens, and working closely with students and parents to understand their specific dietary needs.
Yes, most countries have regulations and guidelines to ensure food safety in education catering. These regulations cover food preparation, storage, handling, and serving to prevent foodborne illnesses.
To reduce food waste, educational institutions often plan menus carefully, monitor portion sizes, and implement recycling and composting programs. They may also work with food banks to donate surplus food.
Discuss your needs with our analyst
Please share your requirements with more details so our analyst can check if they can solve your problem(s)