Table of Contents
- Introduction
- Editor’s Choice
- Global Cookies Market Overview
- Nutritional Composition of Cookies
- Fastest Rising Ingredients & Flavors for Cookies
- Cookies Sales Statistics
- Consumer Preferences in Cookie Consumption
- Cookie and Cracker Consumption – By Country
- Top Cookies Exporting Nations
- Latest Trends in Cookies & Snacking
- Regulatory Requirements for Cookies
Introduction
According to Cookies Statistics, Cookies, also known as biscuits in some places, are popular baked treats made from a mixture of flour, sugar, fat, and flavorings such as chocolate chips or nuts. They come in a variety of types like chocolate chip, oatmeal, and peanut butter, each with its unique taste and texture.
Making cookies involves combining the ingredients, shaping the dough, and baking until they turn golden brown. People often enjoy it on their own or with hot drinks.
Nowadays, there’s an increasing demand for healthier options like gluten-free and vegan cookies, as well as for artisanal and gourmet varieties made with high-quality ingredients. Overall, cookies remain a beloved snack enjoyed by people of all ages worldwide.
Editor’s Choice
- The global cookies market accounted for a revenue of 39.8 billion USD in 2023.
- Mondelez International leads the competitive landscape with a significant market share of 15%.
- Europe emerges as the dominant region with the largest market share, capturing 36.0% of the market.
- Cookies contain a total of 171 calories, with 80 calories derived from fat.
- Among the array of ingredients and flavors incorporated, gingerbread leads the trend with an impressive growth rate of 26.32%, reflecting a heightened preference for its warm and spicy flavor profile.
- A majority of consumers show interest in trying a new cookie if it offers a distinctive flavor, while almost a quarter of consumers report an increase in cookie consumption compared to the previous year.
- In 2014, Argentina led the list with the highest consumption, with individuals averaging 12.44 kilograms annually.

Global Cookies Market Overview
Global Cookies Market Size
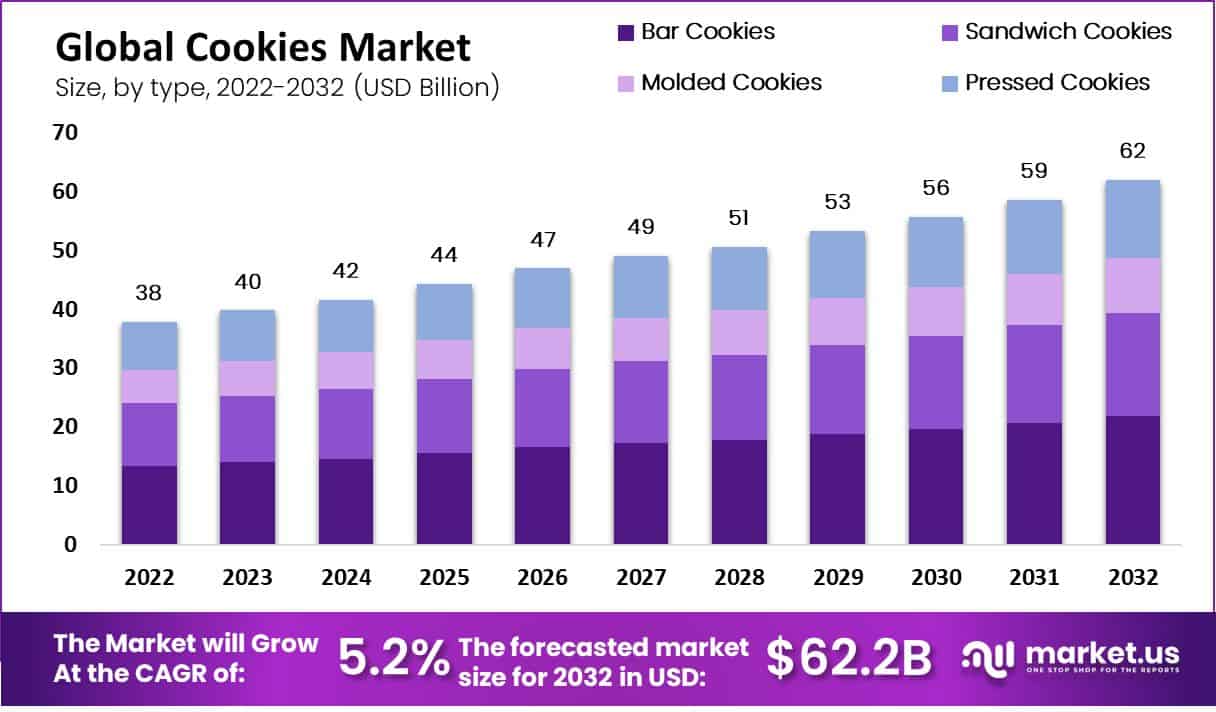
- The global cookies market has demonstrated steady growth in revenue over the years, with a notable increase from 37.8 billion USD in 2022 to 62.2 billion USD in 2032 at a CAGR of 5.2%.
- The market experienced incremental gains annually, with revenue reaching 39.8 billion USD in 2023 and progressively rising to 41.6 billion USD in 2024, 44.4 billion USD in 2025, and 47.0 billion USD in 2026.
- The market’s expansion persisted, culminating in revenue of 55.8 billion USD in 2030, 58.8 billion USD in 2031, and finally, 62.2 billion USD in 2032.

Key Players in the Global Cookies Market
- In the global cookies market, several key players dominate the landscape, each contributing to the industry’s dynamics.
- Mondelez International leads the pack with a significant market share of 15%, followed closely by Brittania Industries Ltd. and Campbell Soup Company, each holding 10% and 11% respectively.
- Ferrero International S.A. and PepsiCo Inc. also play substantial roles, both commanding an 11% share.
- Meanwhile, McKee Food Corporation and Bahlsen GmbH contribute 5% and 9% respectively. Another notable player in the market is Brittania Industries Ltd., securing an 8% share.

Regional Analysis of the Global Cookies Market
- The regional analysis of the global cookies market reveals varying market shares across different geographical areas.
- Europe emerges as the dominant region with the largest market share, capturing 36.0% of the market.
- Following closely behind is North America, holding a substantial share of 29.0%.
- In the Asia-Pacific (APAC) region, the market share stands at 16.2%, reflecting significant but comparatively lower consumption levels.
- Latin America and the Middle East & Africa (MEA) regions contribute 14.6% and 4.2% respectively to the global market.

Nutritional Composition of Cookies
- The nutritional composition of two large cookies, each serving 54 grams, is diverse.
- These cookies contain a total of 171 calories, with 80 calories derived from fat.
- They contain 8.8 grams of total fat, constituting 14% of the recommended daily intake.
- Cholesterol content is minimal at 1 milligram, representing 0% of the daily value.
- The cookies provide 153 milligrams of sodium, contributing 6% to the daily intake recommendation. Additionally, each serving contains 2.5 grams of protein.
- Total carbohydrates amount to 22.0 grams, with 7% of the daily value, including 2.0 grams of dietary fiber.
- In terms of vitamins and minerals, the cookies contain 0% of the recommended daily intake for Vitamin A, 2% for calcium, and 4% for iron.

Fastest Rising Ingredients & Flavors for Cookies
- Among the array of ingredients and flavors incorporated into cookies, certain options have seen notable growth rates, indicating rising popularity among consumers.
- Gingerbread leads the trend with an impressive growth rate of 26.32%, reflecting a heightened preference for its warm and spicy flavor profile.
- Tea-infused cookies follow suit, experiencing a significant surge in demand with a growth rate of 16.85%.
- Berry-flavored cookies also witness a notable uptick in popularity, boasting an 8.96% growth rate.
- Biscuit and coffee flavors round out the list, with growth rates of 8.21% and 6.27% respectively, indicating sustained interest in these classic natural flavors among cookie enthusiasts.

Cookies Sales Statistics
Center Store Cookies
- Over the past 52 weeks ending on March 26, 2023, data from Circana in Chicago reveals significant growth in the “center store cookies” category, which includes pre-packaged bakery items.
- Sales within this category surged by 27.5% compared to the same period in 2022, amounting to a total of $991 million in sales.
- In the “center store traditional cookies” category, sales reached $833 million, marking a 26.7% increase.
- Meanwhile, the “center store iced/frosted cookies” category generated $142 million in sales, experiencing a 30.4% increase.
- Notably, the “center store assorted/multi-pack cookies” subsection saw sales of $11.3 million, reflecting a remarkable 73.6% increase from 2022.
Perimeter Cookies
- In 2023, the “perimeter cookies” category, which includes freshly baked options, sales reached $2.5 billion, marking an increase of 15.2% from 2022.
- Specifically, in 2023, the “perimeter traditional cookies” subsection accounted for $1.669 billion in sales, representing an increase of 15.8%.
- Additionally, the “perimeter specialty cookies” subsection brought in $203 million, showing a 14.5% increase, while the “perimeter iced/frosted cookies” subsection saw sales of $399 million, reflecting a 20.1% increase.
Consumer Preferences in Cookie Consumption
- A significant majority, accounting for 56%, cite treating themselves or their households more as a top motivation for indulging in cookies. This reflects a desire for small indulgences and moments of self-care.
- Additionally, 50% of respondents mention baking more often as a reason for consuming cookies, suggesting increased home baking activities and a preference for freshly made treats.
- Moreover, 45% express a need for more comfort, indicating that serves as a source of solace and nostalgia during challenging times.
- These reasons underscore the multifaceted role that play in providing both physical pleasure and emotional comfort to consumers.

Cookie and Cracker Consumption – By Country
- In 2014, the per capita consumption of cookies and crackers varied significantly by country.
- Argentina led the list with the highest consumption, with individuals averaging 12.44 kilograms annually.
- Following closely behind was the United Kingdom, where per capita consumption stood at 10.02 kilograms.
- Italy and the United States recorded consumption rates of 7.37 kilograms and 6.91 kilograms respectively.
- Brazil, Russia, and France also demonstrated considerable consumption levels, ranging from 5.75 to 5.56 kilograms per capita.
- Meanwhile, Mexico showed a slightly lower consumption rate of 4.75 kilograms.

Top Cookies Exporting Nations
- The top exporters of cookies by country are led by Mexico, with exports totaling $1,168,551,000 and showing a growth rate of 24.2%.
- Following closely behind are Germany and the Netherlands, with exports valued at $840,811,000 and $840,333,000 respectively, both experiencing modest growth rates.
- Belgium and Canada also feature prominently in the list, exporting worth $618,510,000 and $564,494,000 respectively, with notable growth rates.
- Turkey and Italy follow suit, with exports of $431,826,000 and $405,173,000 respectively, both exhibiting strong growth.

Latest Trends in Cookies & Snacking
- In India, the majority of respondents, accounting for 86%, report regularly scrutinizing nutrition labels before buying snacks, reflecting a strong awareness of dietary choices.
- Similarly, in Indonesia and China, significant proportions of respondents, at 83% and 80% respectively, exhibit a proactive approach to assessing healthy snack nutrition information.
- In contrast, the practice is less prevalent in countries like Mexico, Canada, and Brazil, with 75%, 70%, and 69% of respondents respectively indicating they check nutrition labels before snack purchases.
- In the United States, Australia, South Africa, France, and the UK, around half to slightly over half of respondents engage in this practice, while in Germany, the percentage is lower at 49%.

Regulatory Requirements for Cookies
- Regulatory requirements for cookies encompass various specifications regarding their composition and characteristics.
- These standards typically mandate minimum levels of certain components to ensure quality and consistency across products.
- For total solids, they must contain not less than 36.0 percent, ensuring a sufficient density and texture.
- Similarly, the weight/volume ratio (wt./vole) should not fall below 525 grams per liter to maintain adequate mass and volume.
- Regarding milk fat content, they must contain not less than 10.0 percent milk fat, ensuring a rich and creamy texture. However, the milk fat content should not exceed 2.5 percent to prevent an excessive greasy or oily consistency.
- Additionally, milk protein content (Nx6.38) must meet a minimum threshold, ranging from 3.0 to 3.5 percent, depending on regulatory requirements, to provide essential nutrients and contribute to the cookie’s structural integrity.
Discuss your needs with our analyst
Please share your requirements with more details so our analyst can check if they can solve your problem(s)


