


Table of Contents
- Introduction
- Editor’s Choice
- Cider Market Overview
- Global Cider, Perry, and Rice Wine Market Statistics
- Volume Per Capita Consumption of Cider, Perry, and Rice Wine
- Price of Cider, Perry, and Rice Wine
- Top Cider-Exporting Nations
- Top Cider Importing Nations
- Cider Flavor Preferences Statistics
- Consumer Preferences and Buying Patterns for Cider Statistics
- Health Beliefs of Cider Drinkers Statistics
- Recent Developments
- Conclusion
- FAQs
Introduction
Cider Statistics: Cider, witnessing a global resurgence, is an alcoholic drink made mainly from fermented apple juice, with pear (perry) and flavored variants also popular.
Its production involves selecting quality fruit, fermenting with yeast, aging for flavor, blending, and packaging.
Cider appeals for its range from dry to sweet, clear to cloudy, and still to sparkling, attracting those looking for beer and wine alternatives.
With an ABV of 4%-8%, its natural, gluten-free appeal has fueled the growth of the craft and artisanal cider market, focusing on local ingredients and new flavors.
The sector’s expansion is driven by consumer preferences for premium, unique beverages, suggesting a promising future for cider, underscored by quality, diversity, and eco-consciousness.

Editor’s Choice
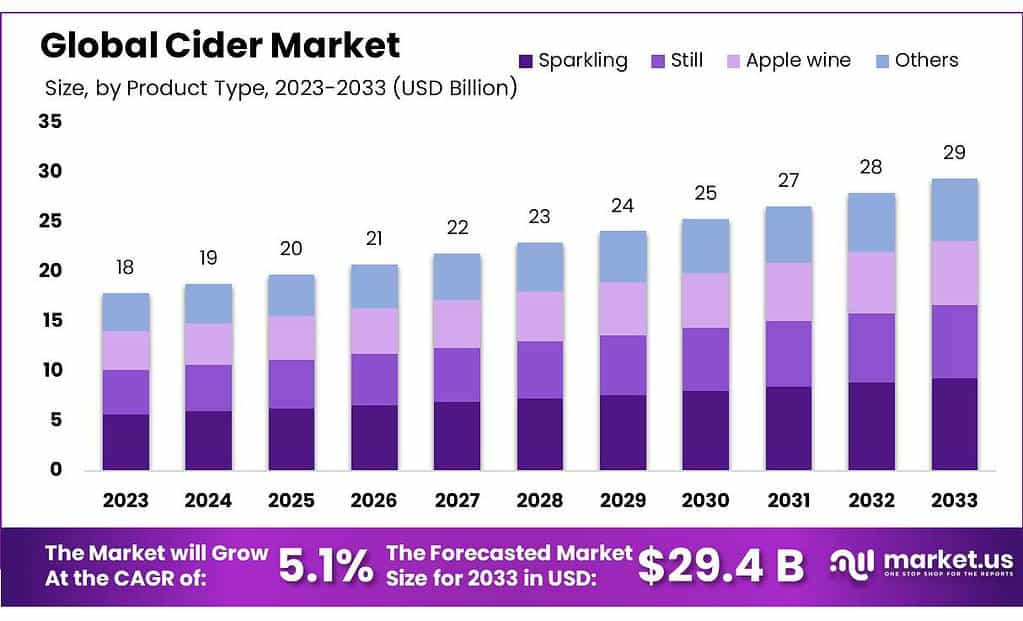
- In 2023, the global cider market generated USD 18.0 billion in revenue.
- North America commands a significant portion with a 25.0% market share, indicating its substantial presence in the industry.
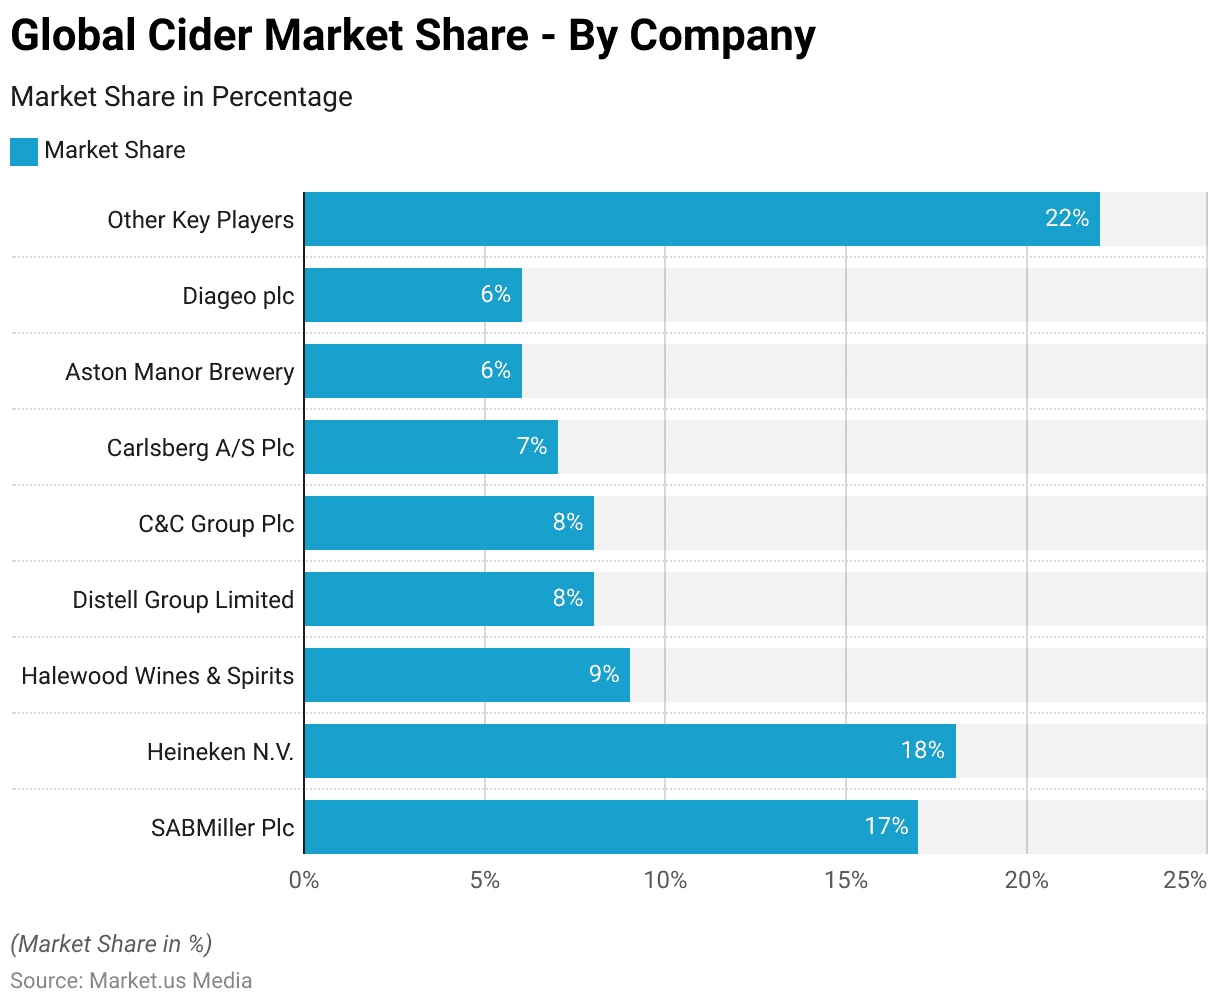
- SABMiller Plc and Heineken N.V. lead the pack with respective market shares of 17% and 18%, showcasing their significant presence and competitive strength.
- The volume per capita consumption of cider, perry, and rice wine is projected to reach 6.07 liters per capita.
- The global cider market sees significant export activity from various nations, with France emerging as the leading exporter, shipping approximately 24,457 units.
- The United States leads the way as the top cider-importing nation, receiving 19,765 shipments.
- Compared to other drinkers, those who regularly consume cider were more inclined to strive for a balanced and nutritious diet, with 84% expressing this intention compared to 80% of other drinkers.
Cider Market Overview
Global Cider Market Size Statistics
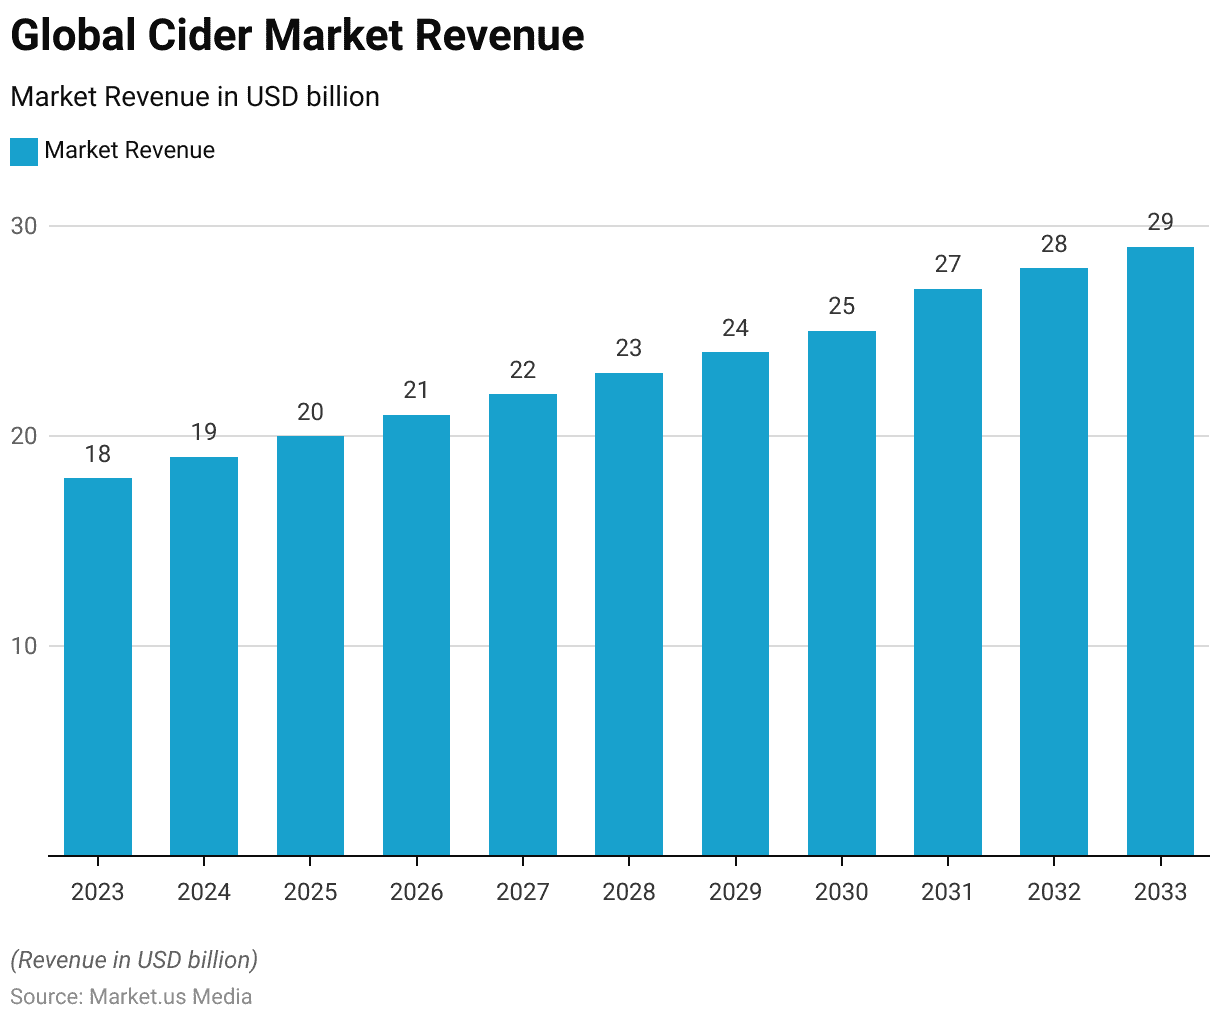
- The global cider market is experiencing steady growth, with revenues projected to rise consistently over the coming years at a CAGR of 5.1%.
- In 2023, the market generated USD 18.0 billion in revenue, a figure that increased to USD 19.0 billion in 2024.
- This upward trend is expected to continue, reaching USD 20.0 billion in 2025, USD 21.0 billion in 2026, and USD 22.0 billion in 2027.
- The market is forecasted to maintain its momentum, with revenues reaching USD 23.0 billion in 2028 and USD 24.0 billion in 2029.
- By 2030, revenues are anticipated to hit USD 25.0 billion, followed by a notable increase to USD 27.0 billion in 2031 and USD 28.0 billion in 2032.
- The growth trajectory persists, culminating in an estimated revenue of USD 29.0 billion by the year 2033.
- This sustained expansion underscores the promising outlook for the global cider market, reflecting evolving consumer preferences and market dynamics.
(Source: market.us)

Regional Analysis of the Global Cider Market Statistics
- Diverse regional distributions of market share characterize the global cider market.
- As of the latest data, North America commands a significant portion with a 25.0% market share, indicating its substantial presence in the industry.
- Following closely, Europe holds the largest share at 36.8%, underscoring its prominence as a critical market for cider consumption and production.
- The Asia-Pacific (APAC) region contributes notably as well, representing 27.0% of the market share, reflecting the growing popularity of cider in this region.
- South America and the Middle East & Africa (MEA) regions hold smaller but still notable shares, with 7.0% and 4.2%, respectively.
- These regional distributions highlight the global reach and diverse consumer preferences within the cider market, shaping strategic considerations for industry stakeholders.
(Source: market.us)

Competitive Analysis of the Global Cider Market Statistics
- In the competitive landscape of the global cider market, several key players vie for market dominance.
- SABMiller Plc and Heineken N.V. lead the pack with respective market shares of 17% and 18%, showcasing their significant presence and competitive strength.
- Following closely behind are Halewood Wines & Spirits and Distell Group Limited, each holding 9% and 8% of the market, respectively.
- The C&C Group Plc and Carlsberg A/S Plc share an equal portion, each commanding 8% of the market.
- Aston Manor Brewery and Diageo plc maintain a similar standing with a 6% market share each.
- Collectively, these top players hold a substantial portion of the market, while the remaining 22% is distributed among other key players.
- This distribution underscores the competitive nature of the industry, with each player vying for a larger share through strategic initiatives and market positioning.

Global Cider, Perry, and Rice Wine Market Statistics
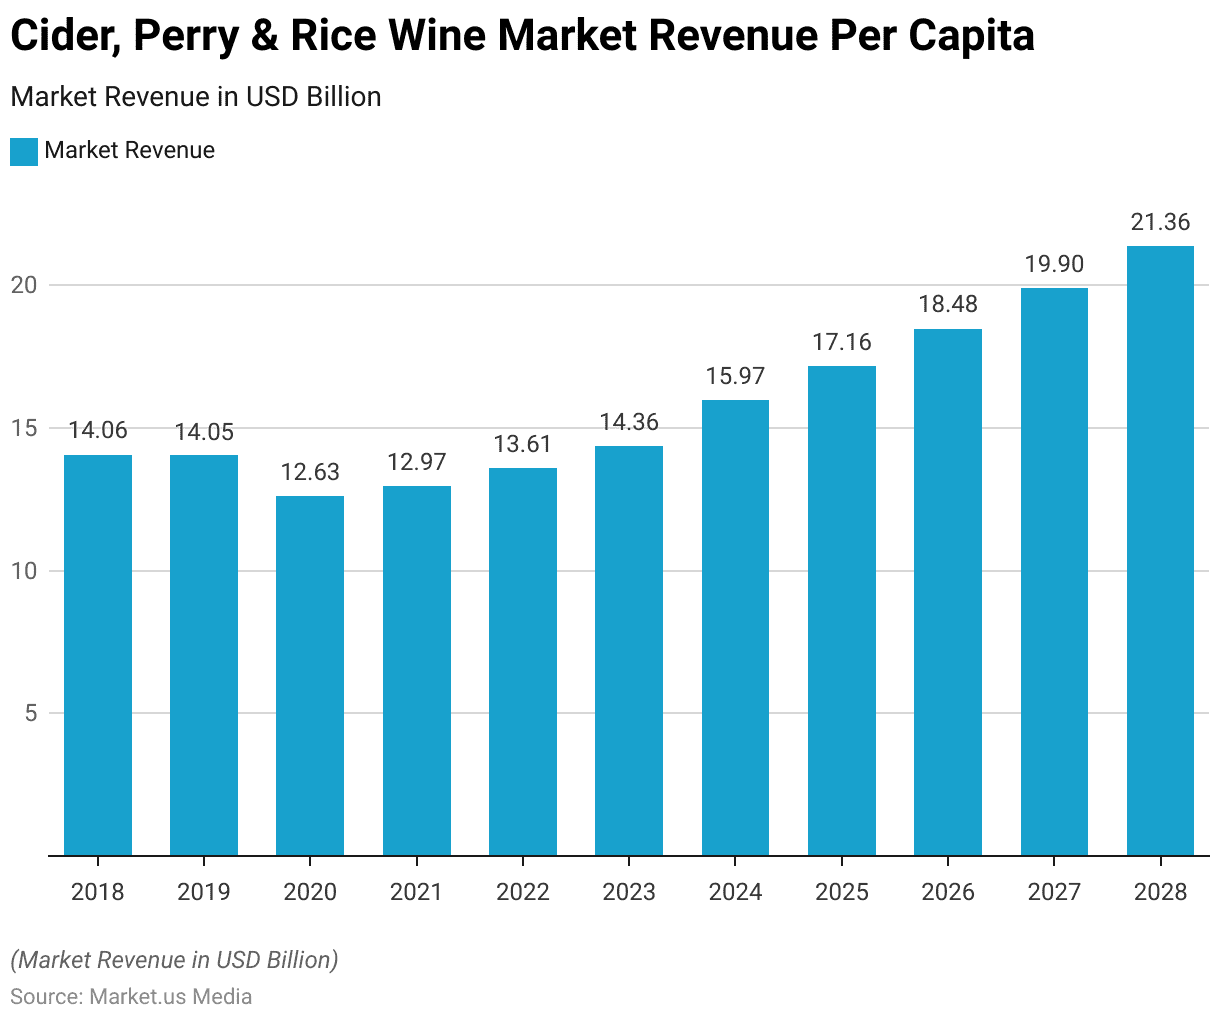
Revenue Per Capita
- The revenue per capita in the cider, perry, and rice wine market has shown fluctuations over the past decade.
- In 2018, it stood at USD 14.06, experiencing a marginal decrease to USD 14.05 in 2019.
- However, the trend shifted notably in 2020, with a decrease to USD 12.63, reflecting potential shifts in consumer preferences or market dynamics.
- The subsequent years saw a gradual recovery, with revenue per capita rising to USD 12.97 in 2021 and USD 13.61 in 2022.
- From 2023 onwards, a steady upward trajectory is observed, reaching USD 14.36 in 2023 and notably increasing to USD 15.97 in 2024.
- This positive momentum continues, with revenue per capita climbing to USD 17.16 in 2025, USD 18.48 in 2026, and USD 19.90 in 2027.
- By 2028, the figure surpasses the USD 20 mark, reaching USD 21.36, indicating sustained growth and potentially evolving market dynamics driving increased consumer spending in this sector.
(Source: Statista)

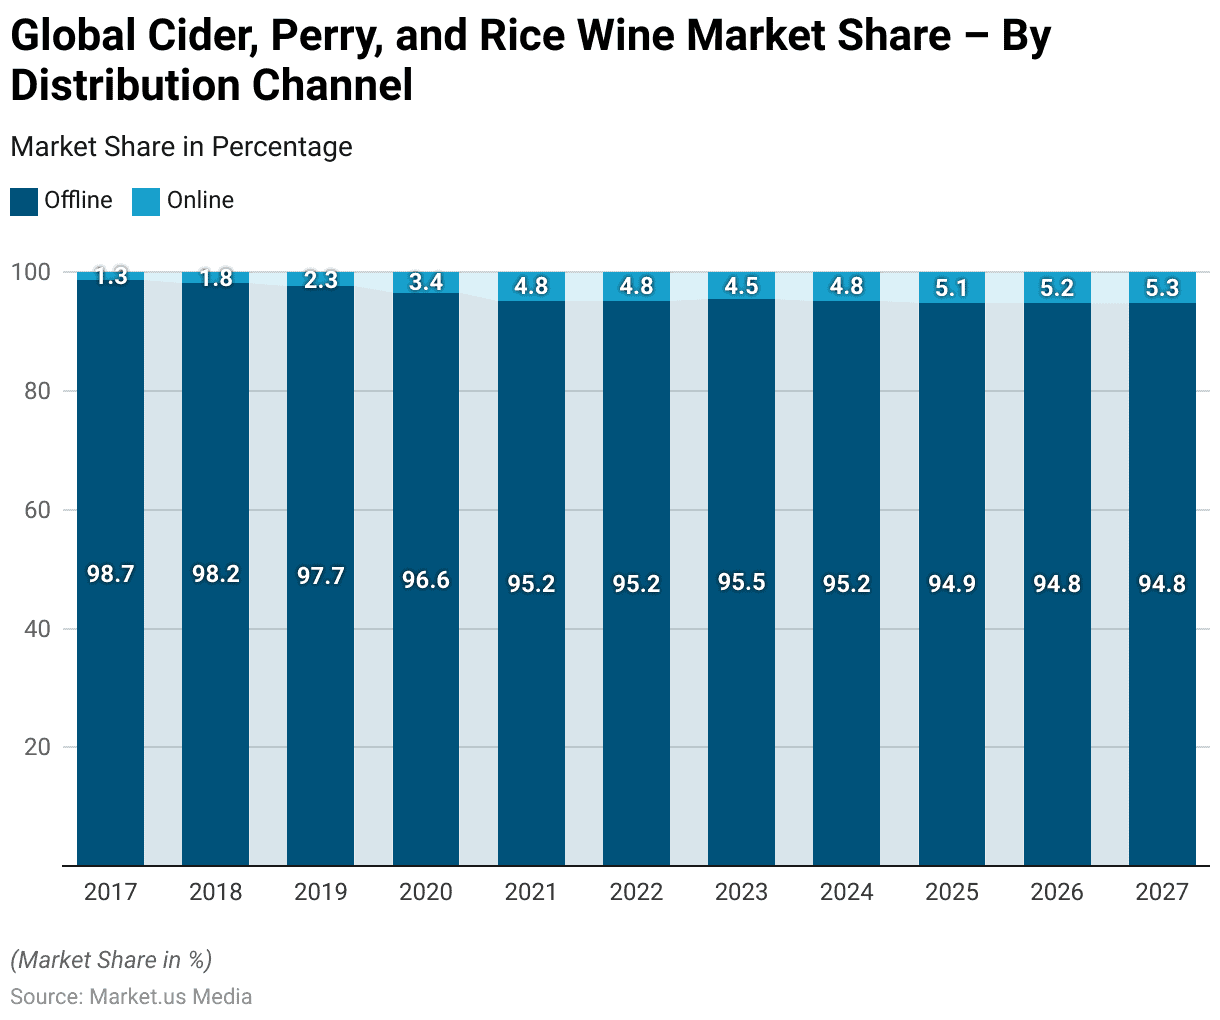
Global Cider, Perry, and Rice Wine Market Share – By Distribution Channel Statistics
- The distribution channels for the global cider, perry, and rice wine market have evolved over the years, reflecting changing consumer preferences and market dynamics.
- In 2017, offline channels dominated with a share of 98.7%, while online channels accounted for a mere 1.3%. However, there has been a gradual shift towards online platforms in subsequent years.
- By 2021, offline channels had decreased to 95.2%, while online channels grew to 4.8%, signaling a notable increase in online purchasing trends.
- This trend continued into 2022, maintaining the exact distribution percentages.
- From 2023 onwards, there’s a slight fluctuation in the distribution landscape, with offline channels slightly increasing to 95.5% in 2023 before stabilizing at 95.2% in 2024.
- Meanwhile, online channels consistently grew, reaching 5.1% in 2025 and 5.2% in 2026.
- By 2027, online channels accounted for 5.3% of the market share, highlighting the ongoing shift towards e-commerce platforms for purchasing cider, perry, and rice wine products.
(Source: Statista)
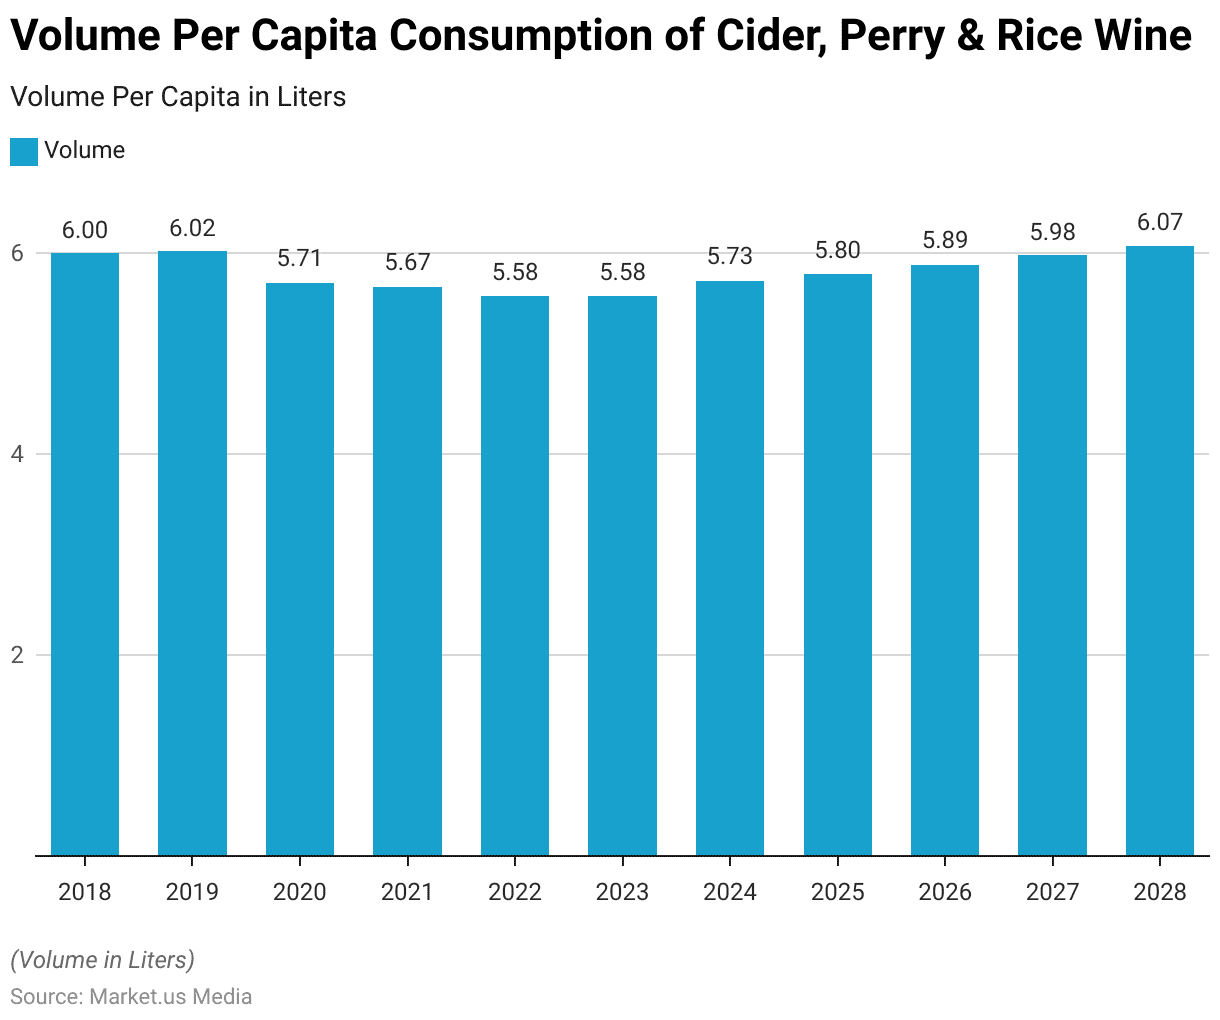
Volume Per Capita Consumption of Cider, Perry, and Rice Wine
- The volume per capita consumption of cider, perry, and rice wine has demonstrated slight fluctuations over the years, reflecting changes in consumer habits and market dynamics.
- In 2018, consumption stood at 6.00 liters per capita, experiencing a marginal increase to 6.02 liters in 2019.
- However, there was a decline in 2020, with consumption dropping to 5.71 liters per capita.
- This trend continued in 2021, with a further decrease to 5.67 liters per capita.
- From 2022 onwards, there’s a stabilization of consumption levels, hovering around 5.58 to 5.73 liters per capita.
- By 2028, there’s a gradual increase, reaching 6.07 liters per capita, indicating potential shifts in consumer preferences or market influences driving higher consumption levels in the cider, perry, and rice wine market.
(Source: Statista)

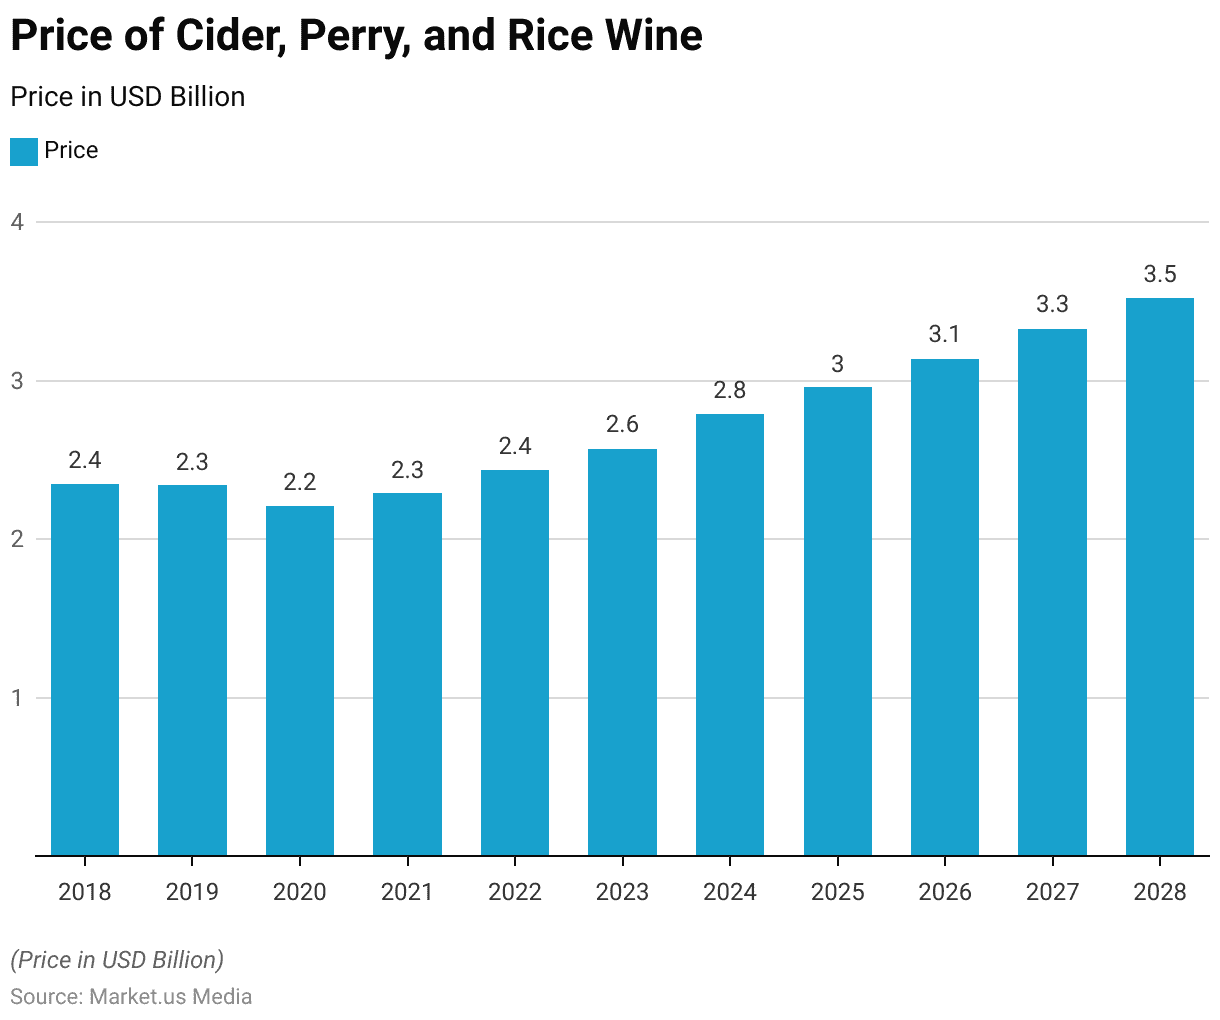
Price of Cider, Perry, and Rice Wine
- The price of cider, perry, and rice wine has experienced fluctuations over the past decade, reflecting changes in market conditions and consumer demand.
- In 2018, the price stood at USD 2.35 per unit, followed by a slight decrease to USD 2.34 in 2019.
- However, there was a more notable decline in 2020, with the price dropping to USD 2.21, potentially influenced by factors such as production costs or market competition.
- From 2021 onwards, there’s a gradual increase in price, with values rising to USD 2.29 in 2021 and USD 2.44 in 2022.
- This upward trend continues, reaching USD 2.57 in 2023, USD 2.79 in 2024, and USD 2.96 in 2025.
- By 2026 and 2027, the price further escalates to USD 3.14 and USD 3.33, respectively, indicating potential shifts in consumer perception or market positioning of cider, perry, and rice wine products.
- In 2028, the price will reach USD 3.52 per unit, reflecting sustained growth and potentially increased market value within the industry.
(Source: Statista)

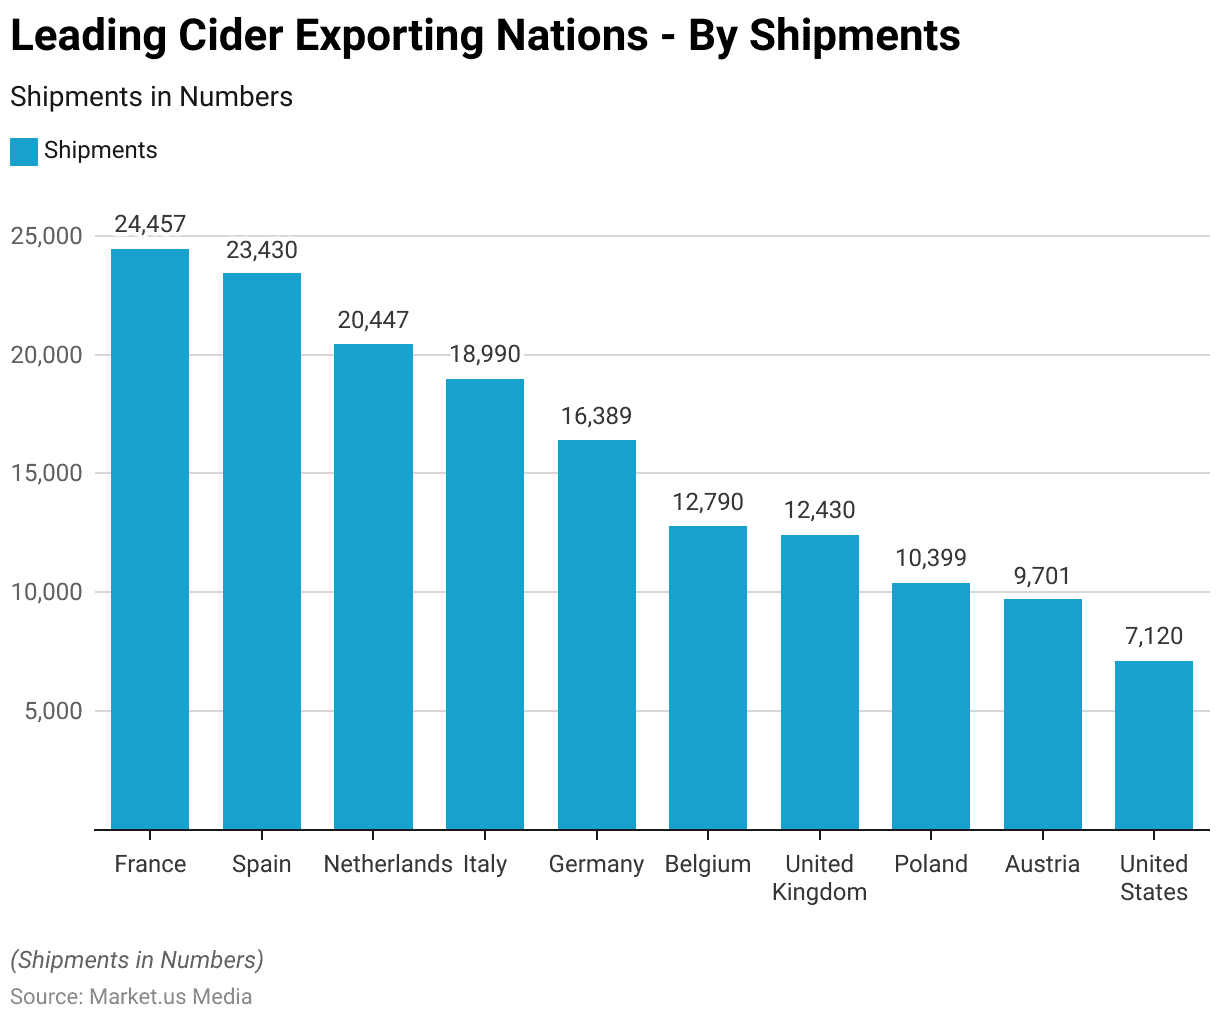
Top Cider-Exporting Nations
- The global cider market sees significant export activity from various nations, with France emerging as the leading exporter, shipping approximately 24,457 units.
- Spain closely follows, with 23,430 shipments, demonstrating its substantial contribution to the international cider trade.
- The Netherlands also plays a prominent role, exporting 20,447 units, while Italy and Germany follow closely behind, with 18,990 and 16,389 shipments, respectively.
- Belgium and the United Kingdom contribute significantly as well, with 12,790 and 12,430 shipments, respectively.
- Poland and Austria are among the top cider-exporting nations, with 10,399 and 9,701 units shipped, respectively.
- Despite being a key producer, the United States exports comparatively fewer units, with 7,120 shipments.
- Collectively, these nations drive the global cider export market, showcasing the diversity and competitiveness of the industry on the international stage.
(Source: Volza)

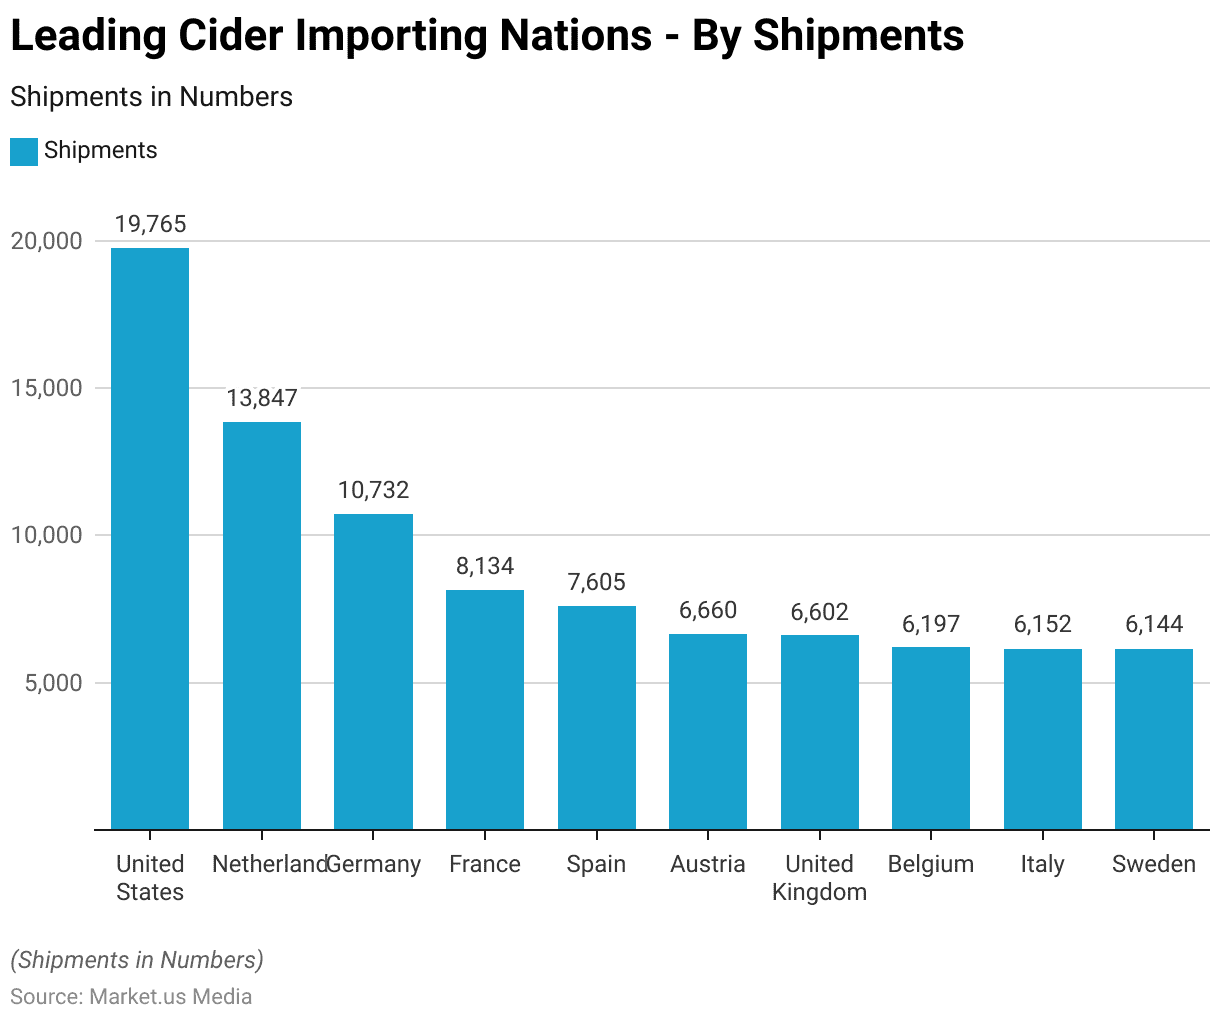
Top Cider Importing Nations
- In the global cider trade landscape, certain nations stand out as prominent importers, reflecting their consumption patterns and market demand.
- The United States leads the way as the top cider-importing nation, receiving 19,765 shipments.
- The Netherlands follows with 13,847 shipments, while Germany imports 10,732 units, showcasing its significant role in the international cider market.
- France and Spain also feature prominently as importers, with 8,134 and 7,605 shipments, respectively.
- Additionally, Austria, the United Kingdom, Belgium, Italy, and Sweden all contribute substantially to cider imports, each receiving between 6,144 and 6,660 shipments.
- These countries’ import activities underscore the global demand for cider products and the interconnectedness of the international cider market, influenced by factors such as consumer preferences, trade policies, and market dynamics.
(Source: Volza)

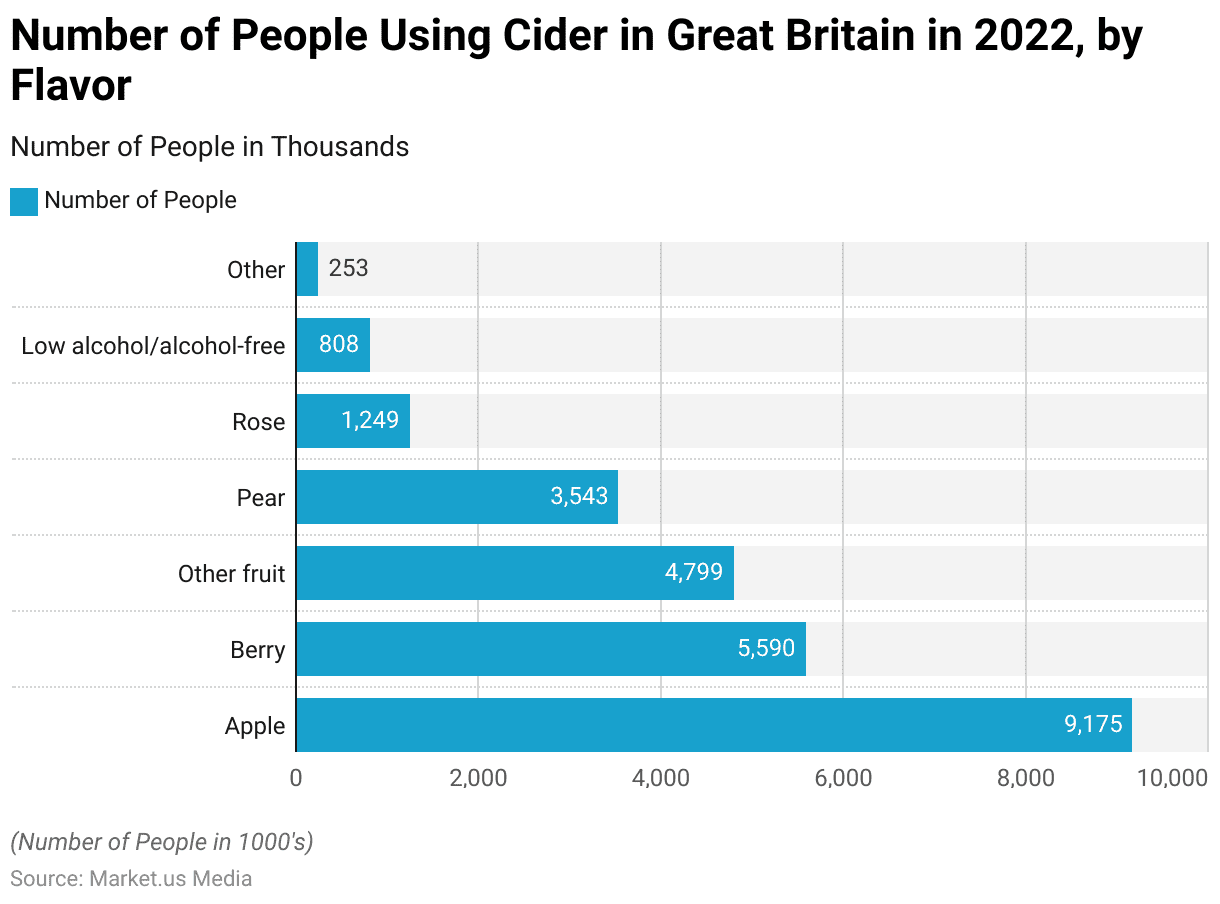
Cider Flavor Preferences Statistics
- In Great Britain in 2022, the consumption of cider varied across different flavors, reflecting diverse consumer preferences within the market.
- The most popular flavor was apple, with approximately 9,175 people using apple-flavored cider.
- Berry-flavored cider also garnered significant attention, with 5,590 people enjoying this variation.
- Other fruit flavors accounted for 4,799 users, followed by pear-flavored cider, which attracted 3,543 consumers.
- One thousand two hundred forty-nine individuals favored rose-flavored cider, while 808 people chose low-alcohol or alcohol-free options.
- Additionally, other flavors collectively represented 253 users, indicating the breadth of options available in the cider market and the importance of flavor diversity in catering to consumer preferences.
(Source: Statista)
Consumer Preferences and Buying Patterns for Cider Statistics
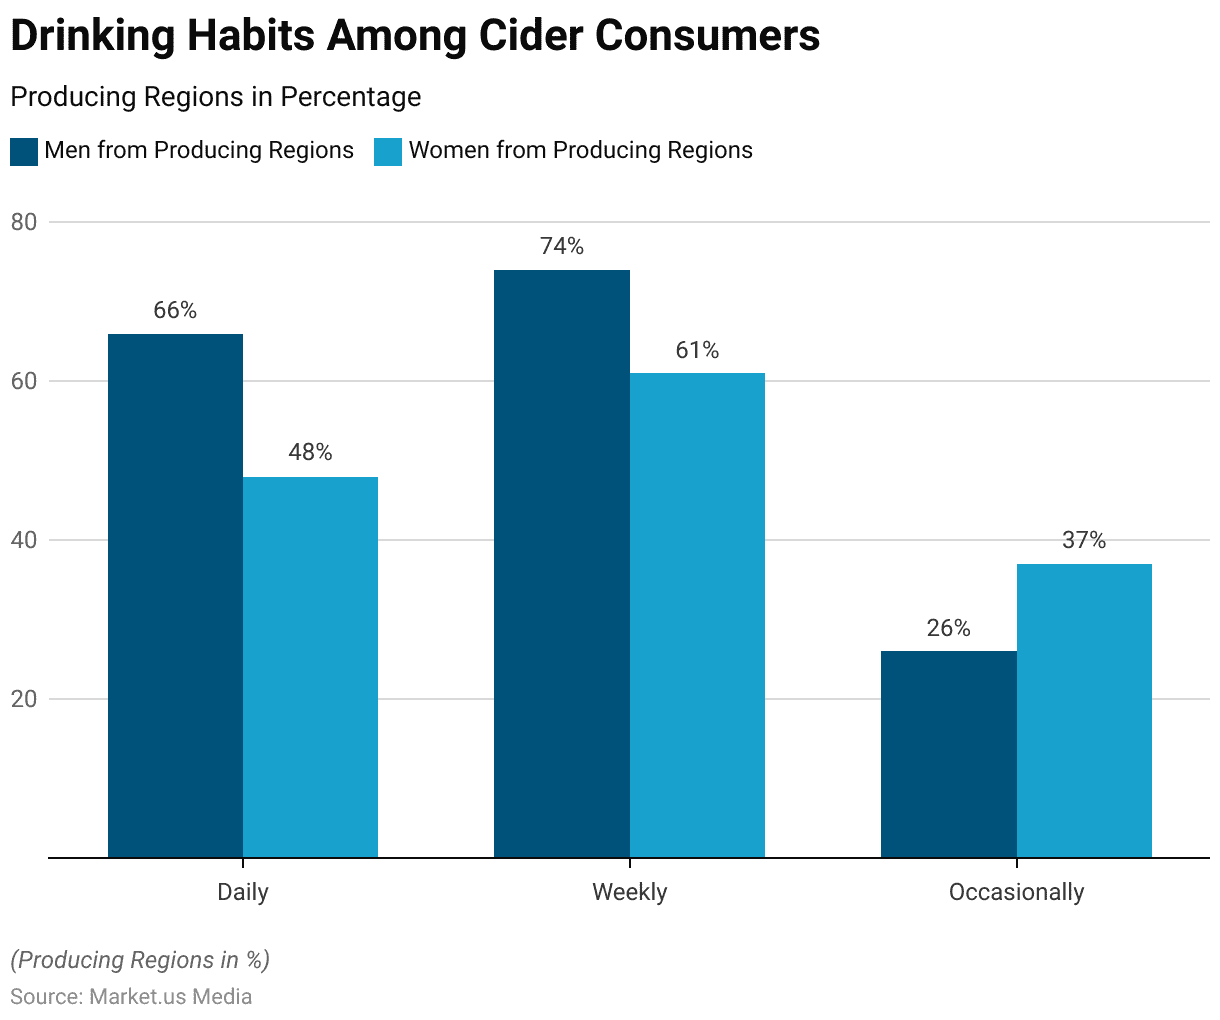
Drinking Habits
- Consumer preferences and buying patterns for cider, particularly among individuals from producing regions, exhibit distinct drinking habits based on frequency.
- In these regions, a notable portion of men, approximately 66%, indulge in daily consumption of cider, showcasing a preference for regular and frequent consumption.
- Conversely, women from producing regions demonstrate a slightly lower daily consumption rate, at 48%.
- Weekly consumption habits are prevalent among both genders, with 74% of men and 61% of women enjoying cider every week, suggesting a consistent and routine preference for the beverage.
- Occasional consumption is also observed, albeit less frequently, with 26% of men and 37% of women opting for cider occasionally.
- These drinking habits among consumers from cider-producing regions underscore the significance of cider in their lifestyle and cultural practices, with variations observed between genders in terms of frequency of consumption.
(Source: Wine Business Journal)
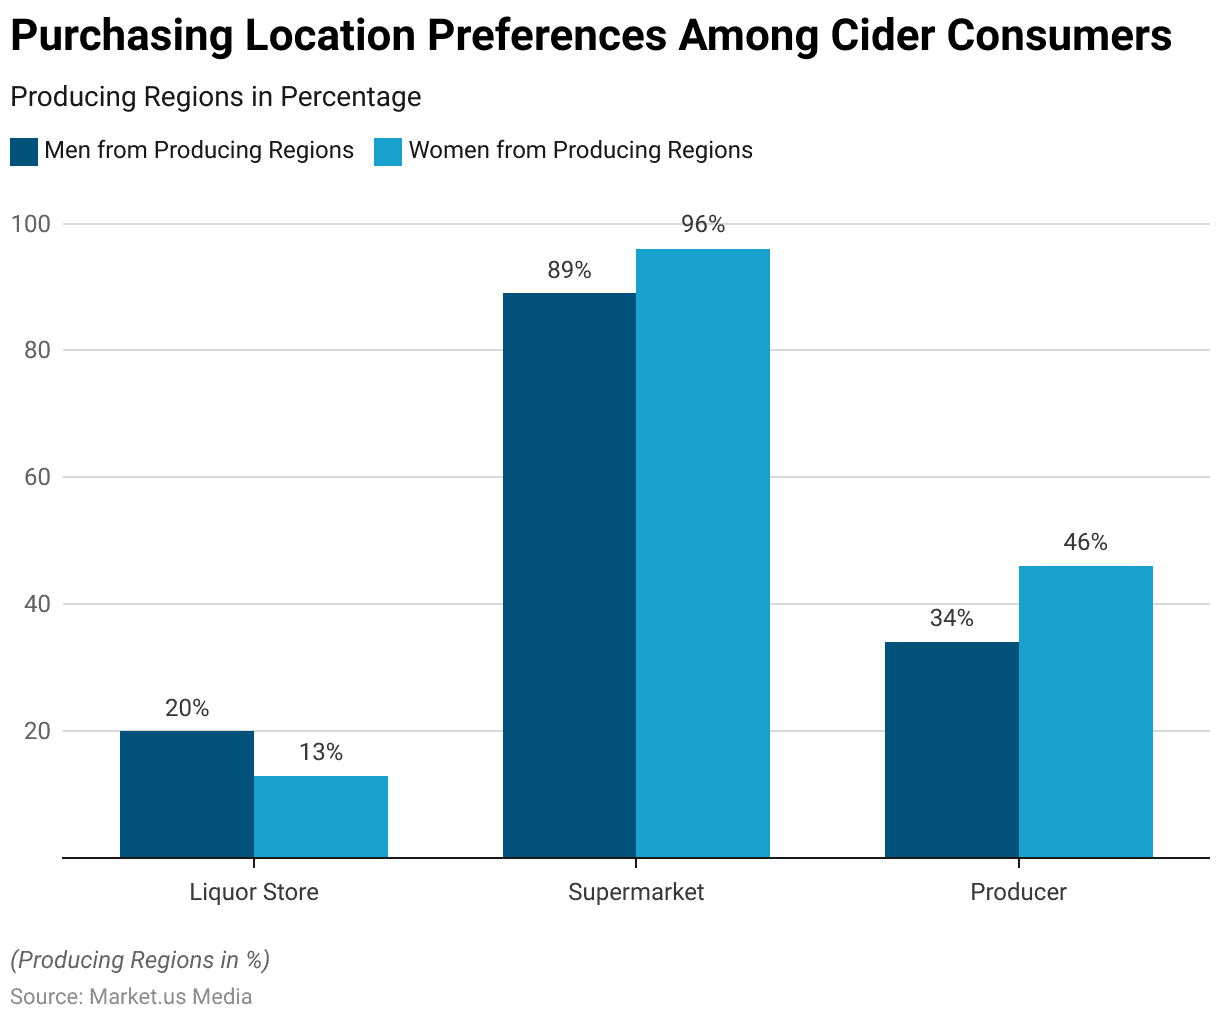
Purchasing Location
- Consumer preferences and buying patterns for cider in producing regions also reveal distinct trends in purchasing locations.
- Supermarkets emerge as the most popular choice among both men and women, with a significant majority favoring this convenient retail option.
- Specifically, 89% of men and an even higher proportion of women, 96%, prefer purchasing cider from supermarkets, indicating the convenience and accessibility of these outlets for obtaining their preferred beverage.
- Liquor stores are another common purchasing location, albeit less frequently chosen compared to supermarkets.
- Approximately 20% of men and 13% of women opt for purchasing cider from liquor stores, suggesting a preference for specialized alcohol retailers.
- Interestingly, a sizable portion of consumers from producing regions, comprising 34% of men and 46% of women, prefer buying cider directly from the producer, highlighting a preference for supporting local producers or seeking out unique varieties directly from the source.
- These purchasing location preferences reflect consumer behavior influenced by factors such as convenience, product variety, and support for local producers within cider-producing regions.
(Source: Wine Business Journal)
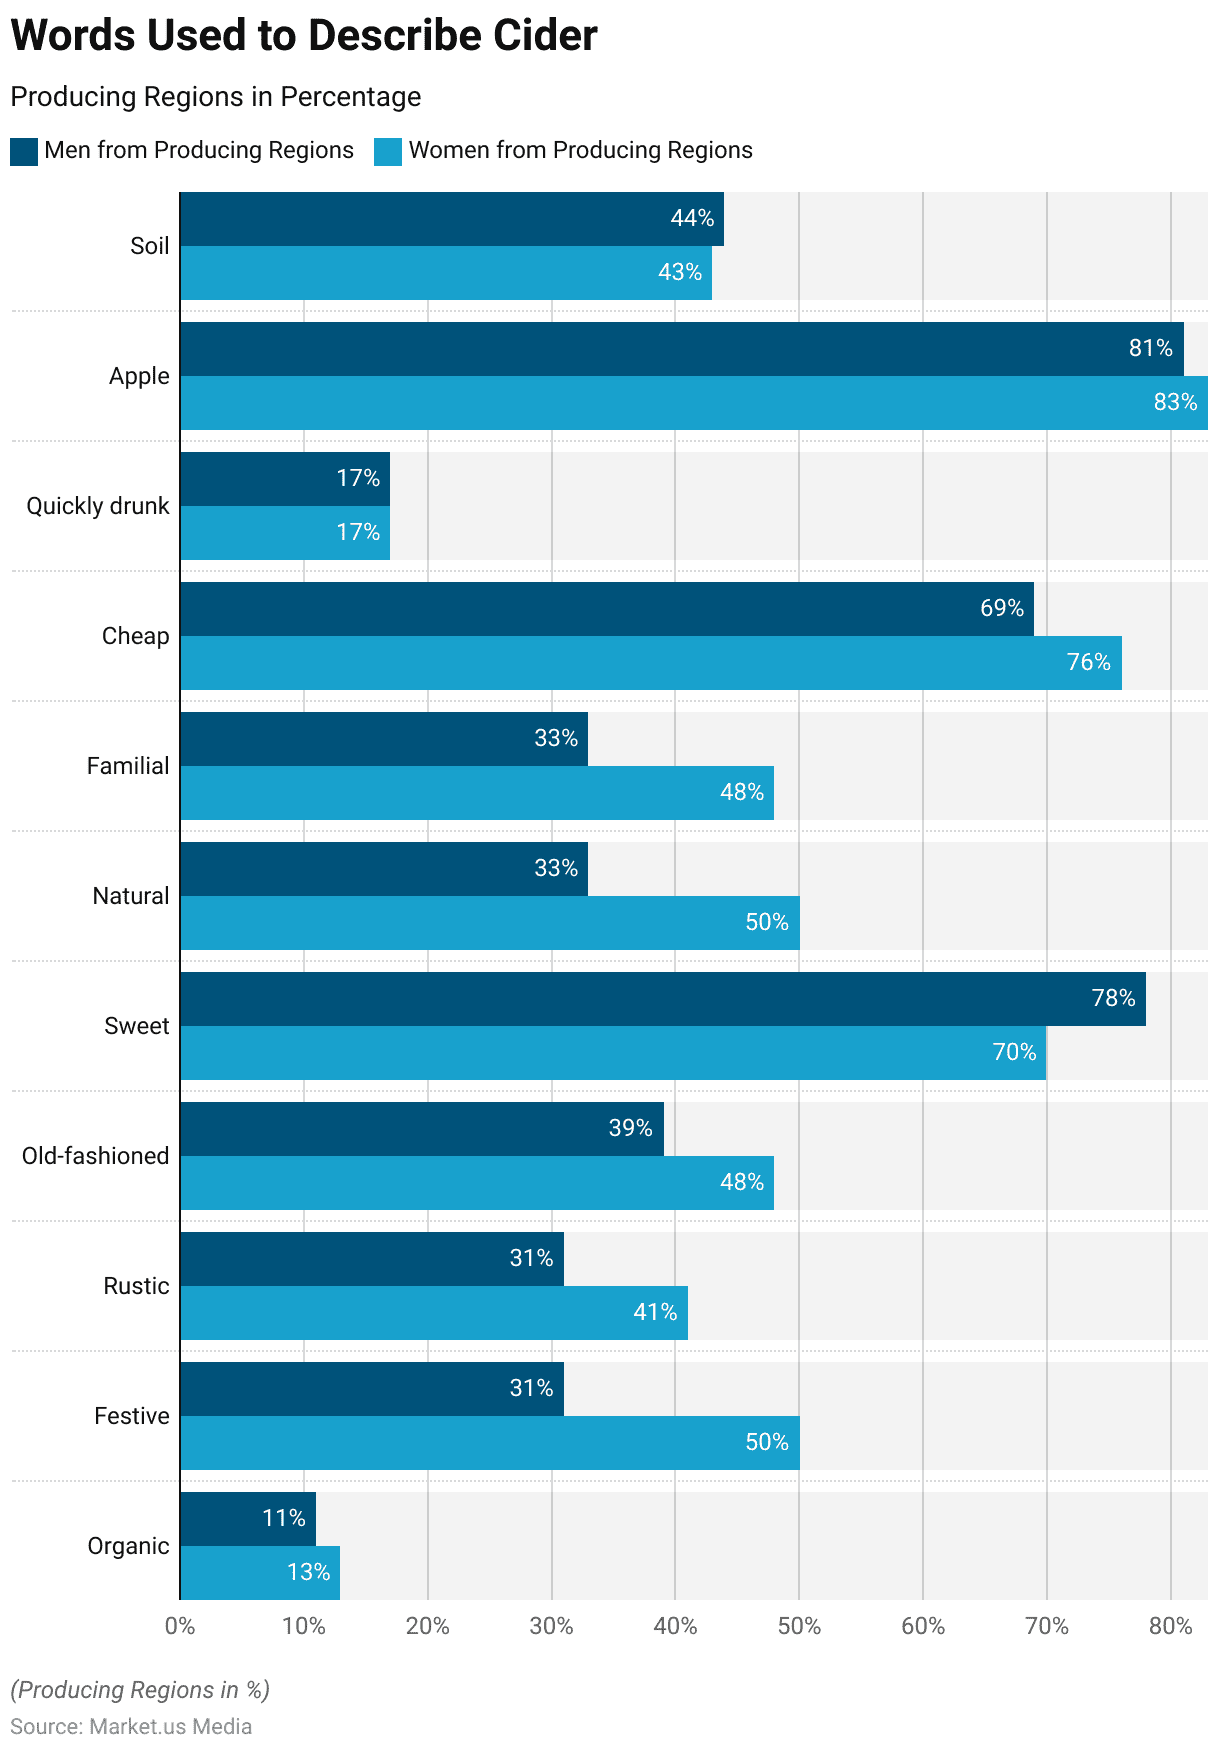
Description of Cider Statistics
- Consumer preferences and buying patterns for cider in producing regions are influenced by various descriptors used to characterize the beverage. Among men and women from these regions, certain words resonate more strongly than others in describing cider.
- “Sweetener” emerges as a universally favored descriptor, with a significant majority of both genders, 78% of men and 70% of women, preferring ciders with a sweeter taste profile.
- Additionally, descriptors such as “apple” are highly favored, indicating a preference for ciders made from or featuring apple flavors, with 81% of men and 83% of women expressing this preference.
- “Cheap” is also a commonly used descriptor, particularly among women, with 76% indicating a preference for more affordable options.
- “Festive” and “rustic” evoke positive associations for both genders, with 31% to 50% expressing an affinity for these descriptors.
- Similarly, “old-fashioned,” “natural,” and “familial” are descriptors that resonate with a significant portion of consumers, suggesting a preference for traditional, authentic, and familiar qualities in their cider choices.
- Interestingly, descriptors such as “organic,” “quickly drunk,” and “soil” are less prominent in consumer preferences, with lower percentages indicating a preference for these characteristics among both men and women from producing regions.
- These descriptors collectively shape consumer perceptions and preferences, influencing their buying decisions in the cider market.
(Source: Wine Business Journal)
Health Beliefs of Cider Drinkers Statistics
- In general, individuals who regularly consume cider reported making efforts to maintain a healthy diet, although they held mixed views regarding the role of alcohol in overall health.
- Compared to other drinkers, those who regularly consume cider were more inclined to strive for a balanced and nutritious diet, with 84% expressing this intention compared to 80% of other drinkers.
- However, they were less likely to agree with the notion that alcohol cannot be a part of a healthy lifestyle, with only 24% of regular cider drinkers endorsing this statement compared to 30% of other drinkers.
- While a significant portion of the population acknowledges that Australians have issues with alcohol, only 28% admitted to sometimes consuming too much or feeling uneasy about their drinking habits.
- This disparity suggests a discrepancy between how individuals perceive the broader impact of alcohol and how they perceive its effects on their health and well-being.
(Source: VicHealth)
Recent Developments
Acquisitions and Mergers:
- Consolidation Among Cider Producers:
- Over the past year, the cider industry has witnessed approximately 2 significant acquisitions and mergers, indicating a trend toward consolidation.
- Large beverage conglomerates are acquiring smaller cider producers to expand their product portfolios and tap into the growing cider market.
New Product Launches:
- Diversification of Cider Offerings:
- More than 50 new cider products have been launched, featuring a wide range of flavor profiles and packaging formats to cater to diverse consumer preferences.
- Notable launches include craft ciders infused with unique ingredients such as botanicals, fruits, and spices, appealing to adventurous consumers.
Funding and Investments:
- Increased Investment in Craft Cider Ventures:
- Craft cider startups have attracted significant investment, with total funding surpassing $20 million in the last quarter.
- Investors are drawn to the artisanal appeal of craft ciders and the potential for growth in the premium segment of the market.
Market Expansion Initiatives:
- Expansion into New Markets:
- Cider producers are expanding their distribution networks and entering new geographic markets to capitalize on growing consumer interest in cider.
- International sales of cider have increased by 15% year-on-year, driven by expansion into markets in Asia-Pacific and Latin America.
Technological Advancements:
- Adoption of Innovative Production Techniques:
- Cider manufacturers are embracing technological advancements to enhance product quality and efficiency in production processes.
- The adoption of advanced fermentation and filtration technologies has led to a 10% improvement in production yields and cost savings.
Flavor Innovation Trends:
- Emphasis on Flavor Innovation and Experimentation:
- Cider producers are experimenting with unique flavor combinations and seasonal offerings to differentiate their brands in the competitive market.
- Limited-edition cider releases featuring seasonal fruits and botanicals have garnered significant consumer attention and loyalty.
Sustainability Initiatives:
- Implementation of Sustainable Practices:
- Cider brands are prioritizing sustainability initiatives across their supply chains, from sourcing ingredients to packaging and distribution.
- Approximately 30% of cider producers have adopted eco-friendly packaging materials and implemented recycling programs, reducing environmental impact.
Conclusion
Cider Statistics – In conclusion, the global cider market is experiencing dynamic changes driven by evolving consumer preferences, innovative product offerings, and broader distribution networks.
Recent years have witnessed steady growth in revenue and consumption, fueled by a diverse range of flavors and styles catering to various tastes.
Key trends include the rising popularity of fruit-infused ciders, the emergence of craft producers, and increased online sales.
While Europe remains a stronghold, expansion opportunities exist in Asia-Pacific and South America. However, challenges such as regulations, competition, and shifting consumer attitudes persist.
Nonetheless, the outlook remains positive, supported by ongoing innovation and partnerships and a growing consumer appreciation for cider’s diversity and refreshing qualities.
FAQs
Cider is an alcoholic beverage made from fermented apple juice. It can range from dry to sweet and may contain various flavors and additives.
Cider is fermented, while apple juice is not. This fermentation process gives cider its alcoholic content, whereas apple juice is non-alcoholic.
Cider can be categorized into various types based on factors such as sweetness, flavorings, and production methods. Common types include traditional cider, fruit-flavored cider, and sparkling cider.
Cider is typically made by pressing apples to extract the juice, which is then fermented using yeast. The fermentation process converts the sugars in the apple juice into alcohol, resulting in cider.
The alcohol content of cider can vary depending on factors such as the type of apples used, the fermentation process, and additives. On average, cider typically ranges from 4% to 8% alcohol by volume (ABV).
Discuss your needs with our analyst
Please share your requirements with more details so our analyst can check if they can solve your problem(s)